Ontology tree
Tree - Data dictionary relationship
The tree-based ontology browser organizes the database tables hierarchically by assessment domain, subdomain, and other properties. The tree allows you to explore the data organization and provides a high-level overview of research areas.
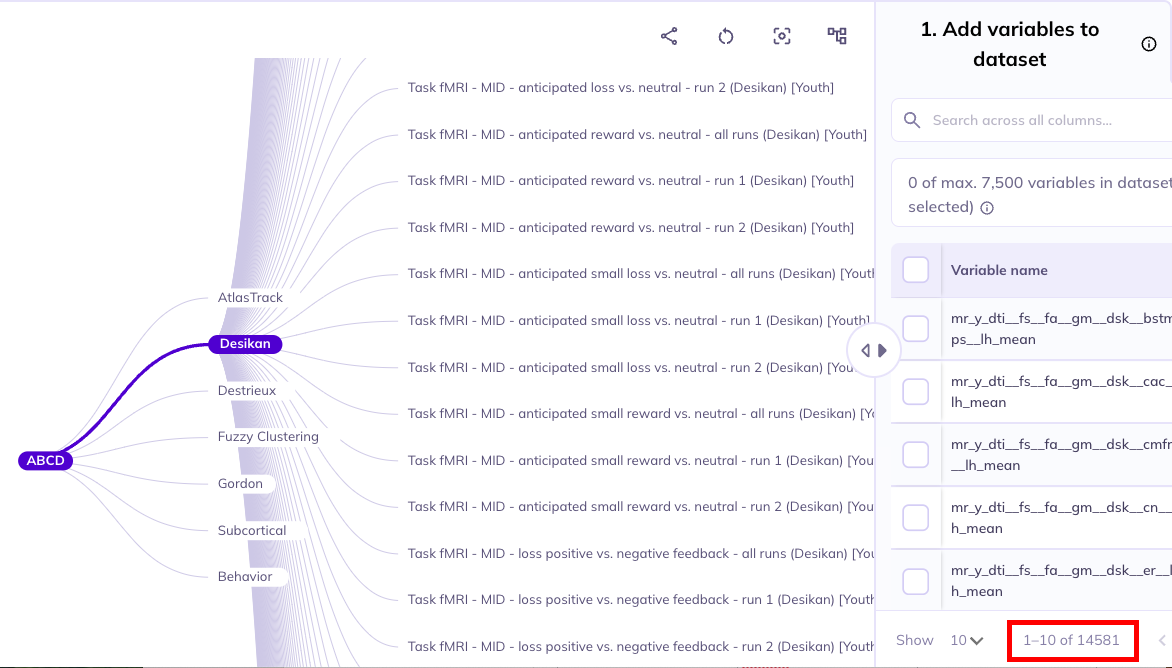
Selections made in the ontology tree act as a filter on the Data Dictionary Table; they reduce the variables displayed in the table to focus it on your selected subset of variables, making their exploration more efficient. By default, the ontology’s root node is selected; as such, the table will include all variables in the ABCD tabulated data resource. Selecting nodes on lower levels of the ontology will narrow the scope of variables included in the data dictionary table. If a node is selected, all measures at that level and below will be included in the table.
The data dictionary table reacts to the ontology tree selections
Ontology display
Navigation
To move around the ontology tree click on the levels you want to open. You can drag the ontology tree around the viewing screen by clicking and dragging. To zoom in/out on the tree pinch and pull in/out with your fingers. With a mouse, you can zoom by scrolling the wheel in or out. If you loose the location of the ontology tree you can click reset () or pan around by clicking until you find it.
Click and drag to pan/move the tree, pinch/scroll to zoom

Display
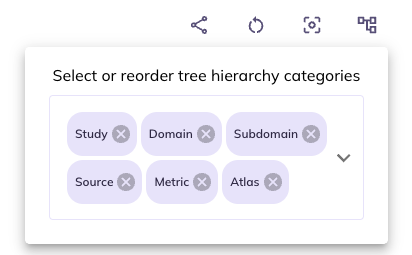
Structure (): You can limit and re-order the ontology tree by selecting . Dragging categories will change the hierarchical order the categories appear in the ontology. Un-selecting a category will remove it from the ontology tree. You can re-select removed categories using the same widget.
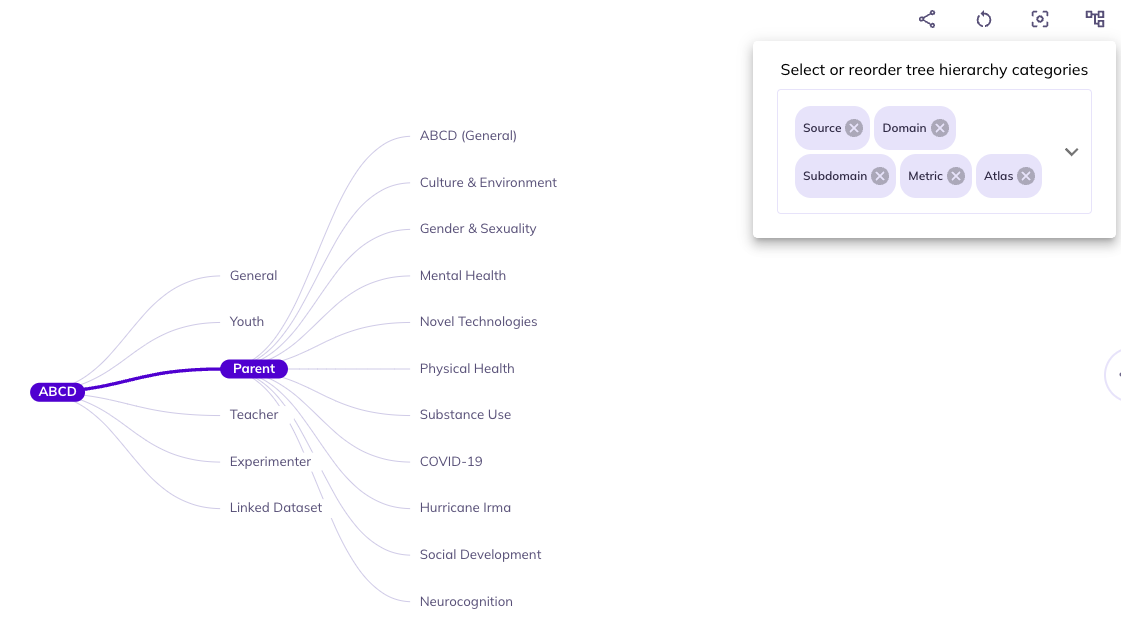
If you are interested primarily in data reported by the parents and don’t have an interest in differentiating between the core protocol and substudies you would unselect Study and drag Source to be first in the ontology. This will reduce your need to click into the core protocol and substudies to find the parent surveys.
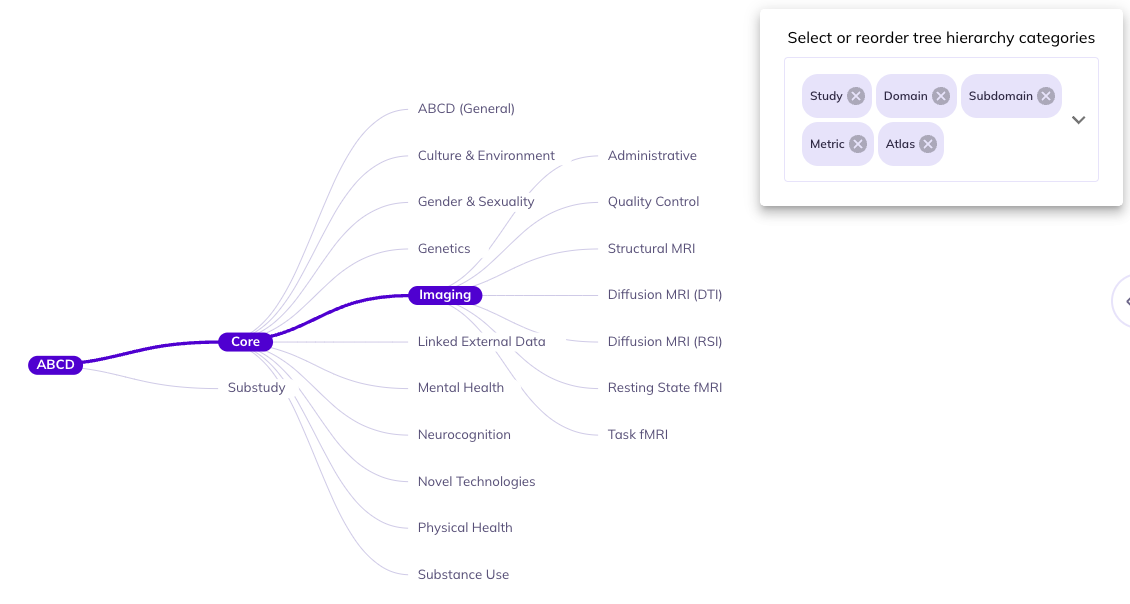
In some contexts certain categories are redundant.For example, data in the imaging domain is only collected from the youth participants Source. As such, you could remove Source to cut down categories to navigate through.
If you want to focus on imaging data from a specific brain atlas (e.g., the Desikan atlas), you might choose to eliminate all categories besides Atlas since everything would be nested under the Core, Study, Imaging, Youth, etc. This would allow you to fast track your selections in the data dictionary table.
Some subdomains exist across multiple domains. You can remove Domain to explore variables from subdomains that exist in different domains.
Focus mode (): Sometimes the ontology tree can become difficult to overlook. You can simplify the tree by focusing only on the path of your current selections and hiding all extraneous elements. Select the focus mode button: to enter focus mode. As you click down the ontology you can re-focus by reselecting . To exit focus mode you can click , located at the root of the focused ontology tree.
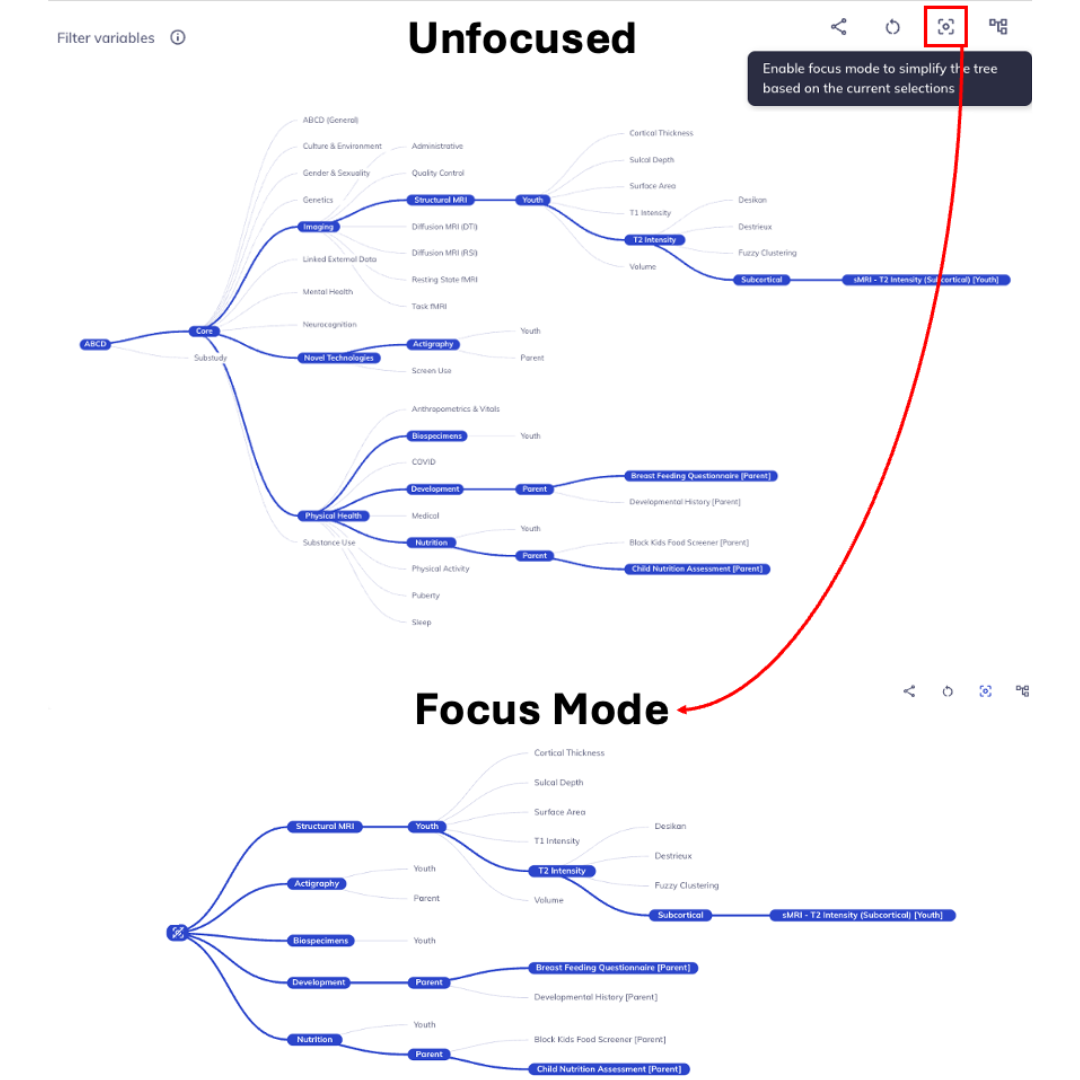
Focus mode removes unselected levels; click the root node to unfocus
Reset the tree (): You can remove selected categories from the ontology tree by re-selecting hierarchically higher categories. Re-selecting the node of a category will hide any selections downstream of it (e.g., clicking Domain will hide Subdomain, Source, etc.). Click Core and/or Substudy to collapse the whole tree branch.
The entire ontology tree can be reset by clicking the reset button: . Any selections, restructuring, or modification of the tree will be undone.
Select upstream levels to collapse content, select to reset the tree
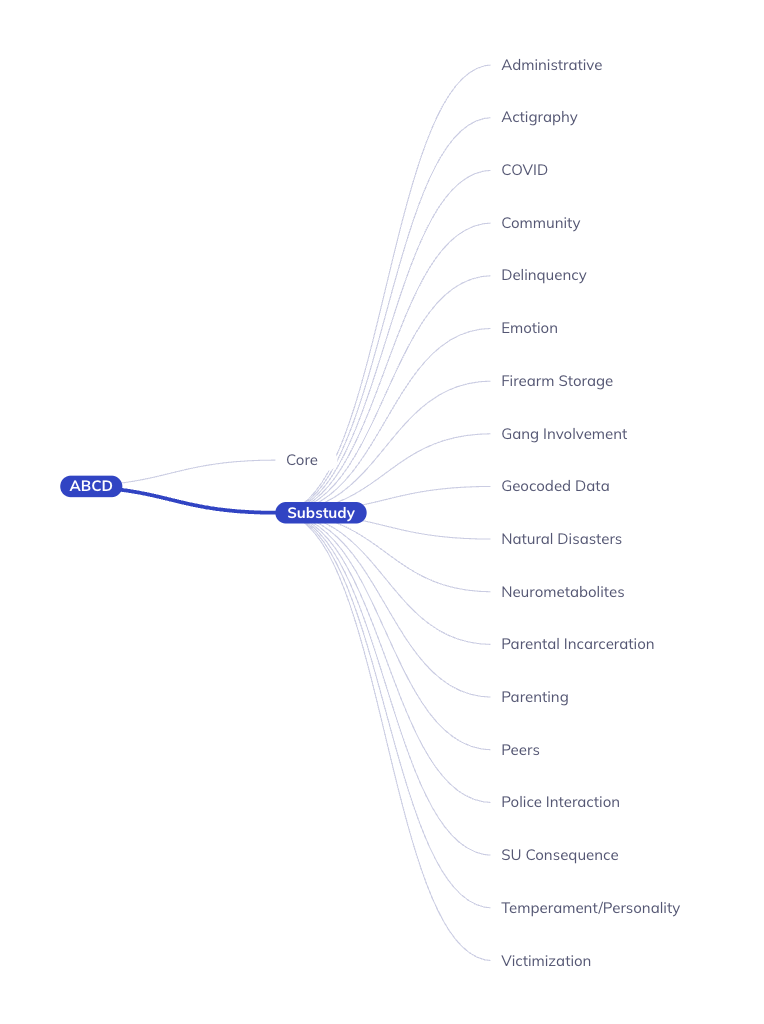
Ontology structure
By default, the ontology tree has the following levels (in the following order):
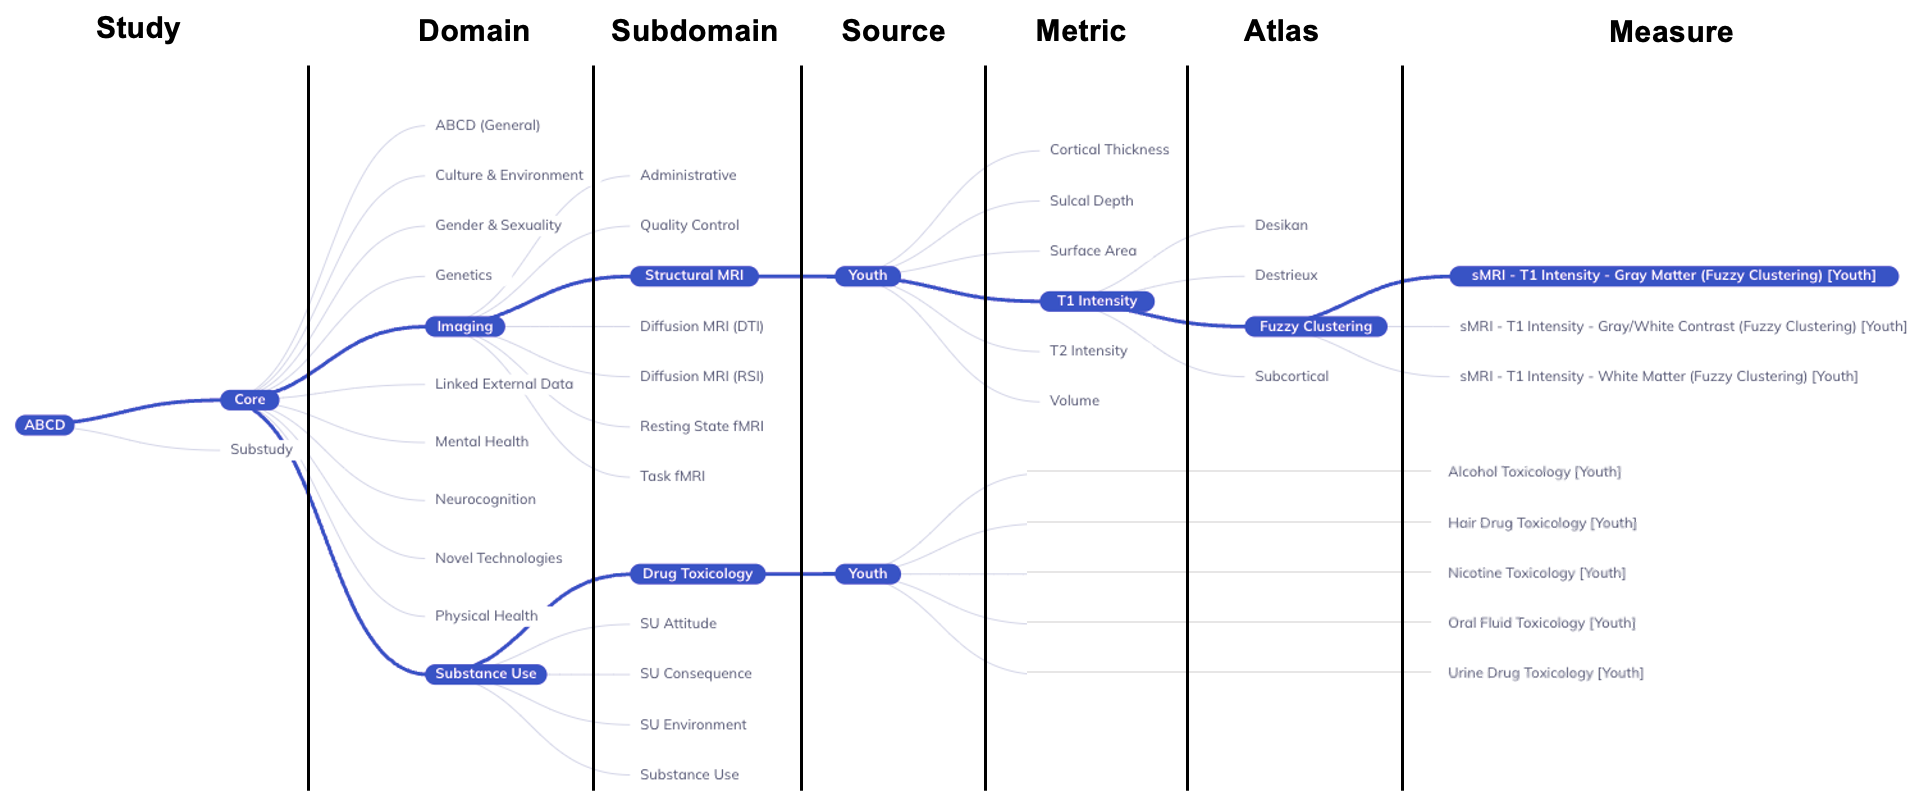
Study: ABCD + Core/SubstudyDomain: Largest grouping of protocol by subject matterSubdomain: Topic of table, can exist across multiple domainsSource: Who provided the dataMetric(imaging only): Derived measures of brain structure or functionAtlas(imaging only): Standardized map of regions of interest (ROI)Measure/Table: Collection of variables with a close relationship of subject matter
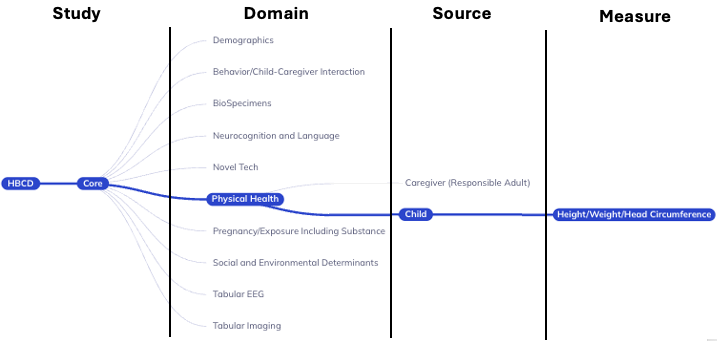
Study: ABCD + Core/SubstudyDomain: Largest grouping of protocol by subject matterSource: Who provided the dataMeasure/Table: Collection of variables with a close relationship of subject matter
To come in future waves:
Metric(imaging only): Derived measures of brain structure or functionAtlas(imaging only): Standardized map of regions of interest (ROI)