Variable details
On the right of each row in the data dictionary table, you can find an eye icon: . Clicking on this icon opens the details view for the respective variable. The details view contains a visual display of that variable’s key meta-data.

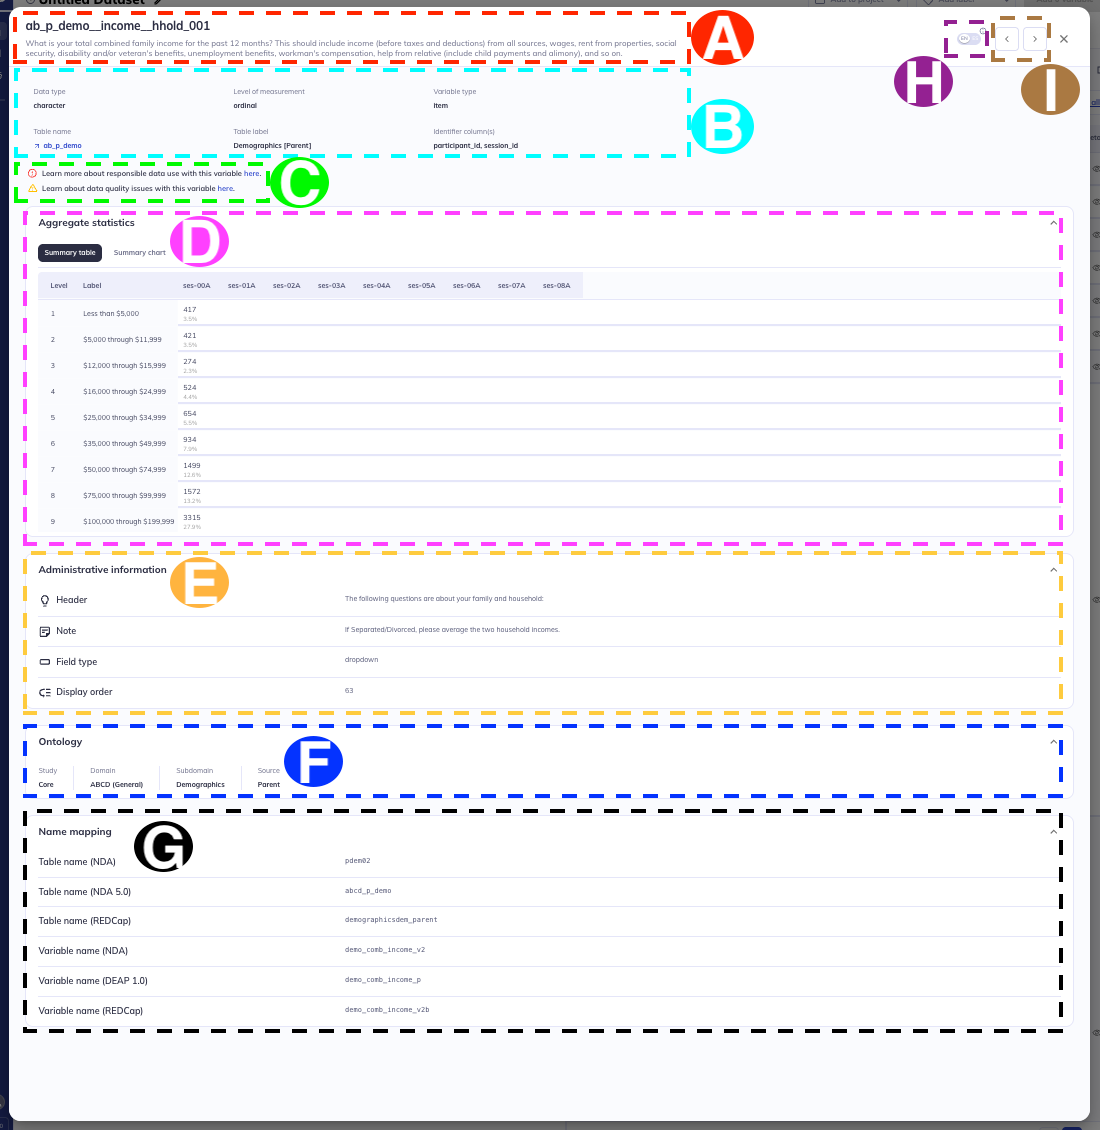
- Variable name & label
- Header
- Variable warnings
- Aggregate statistics
- Administrative information
- Ontology location
- Name mapping
- English - Spanish toggle
- Advance through variables
The details view is a more visual display of much of the information in the data dictionary table. Some components, like the aggregate statistics, are only available in the details view. Not all sections within the details will be shown for every variable; the displayed information depends on the relevance to the variable.
Additional display modifications:
- You can toggle forward and backward through all variables that are displayed on the current page of the data dictionary table using the buttons.
- The language toggle switch (English & Spanish) next to in the top bar allows to switch certain elements between English and Spanish. The toggle will only be present for relevant variables; generally where the source is ‘parent’. The toggle will only switch text that was displayed to the participants (e.g., variable label, instructions, headers, response options, etc.).
The toggle will not translate the DEAP platform, just the display instructions & responses for the participants.
- All variable detail sections can be collapsed/expanded by clicking on the section headers or on .
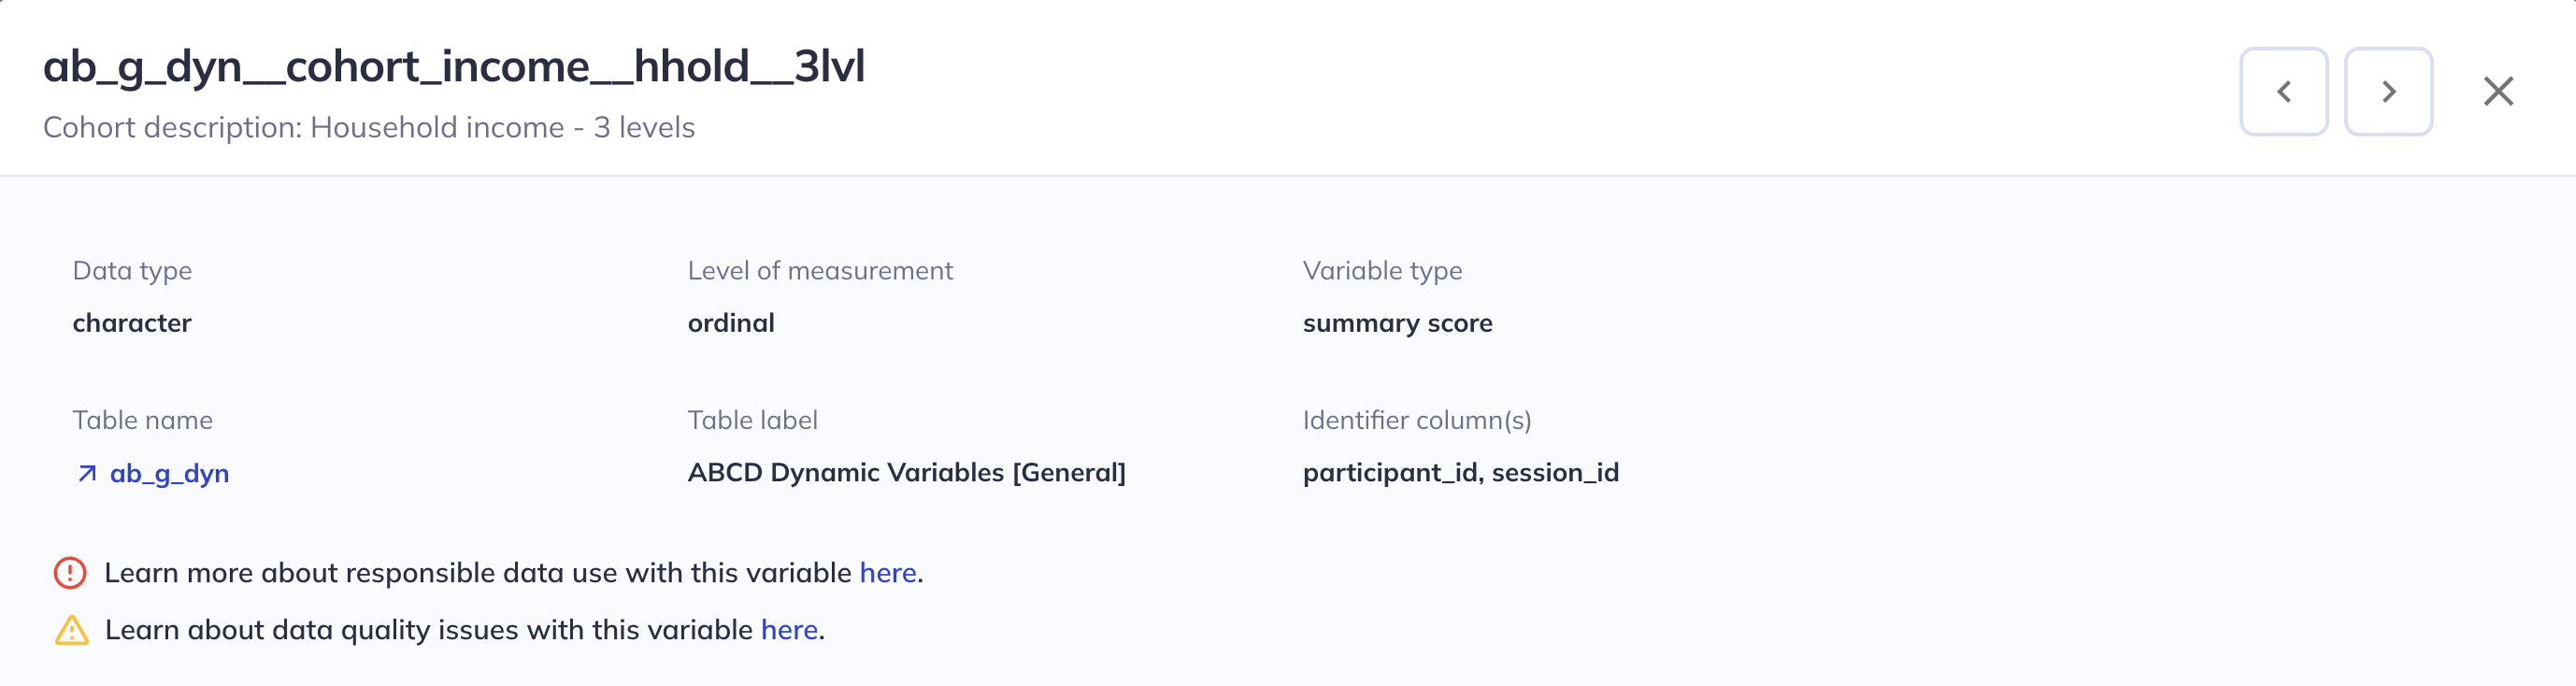
Header
The header lists the Variable name and Variable label. The grey bar below the header lists meta-data including Data type, Variable type, Units (if relevant), Table name, Table label, and Identifier columns (participant_id, session_id, etc).
Some components of the header may contain hyperlinks to external resources. The Table name links to the relevant study documentation about that measure. If a variable has Data warnings, there will be indicators in the details view header & links to the study documentation on those warnings. Variable type may link to R packages with the documentation for the computation the of respective summary scores.
Please review the documentation on data warnings in DEAP for each study.
A header containing variable descriptors, warnings, & links to outside documentation
Brain atlas visualizer
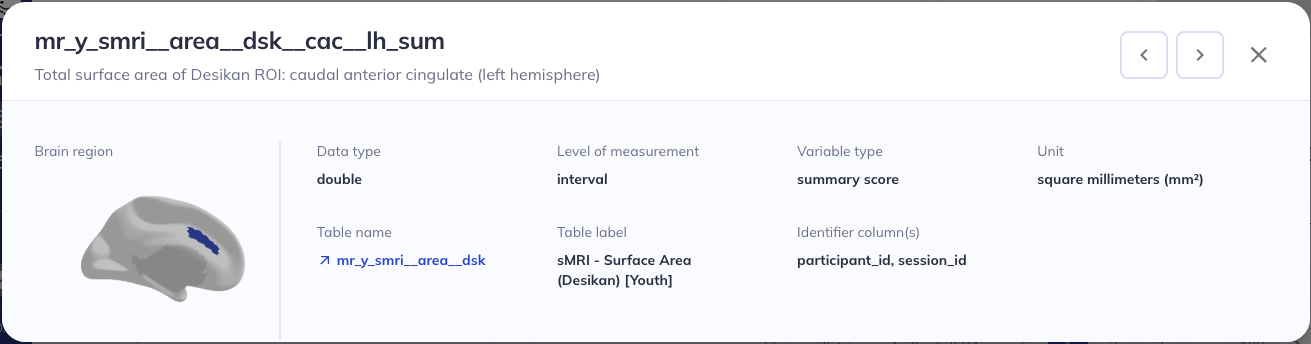
Example header for an imaging variable containing a brain atlas
Variables in the tabulated imaging data from specific brain atlases have an image depicting the region displayed on the left hand side of the variable details header. To see a larger version of the brain region, you can click on the image to open a 3D viewer; here you can rotate & enlarge the image.
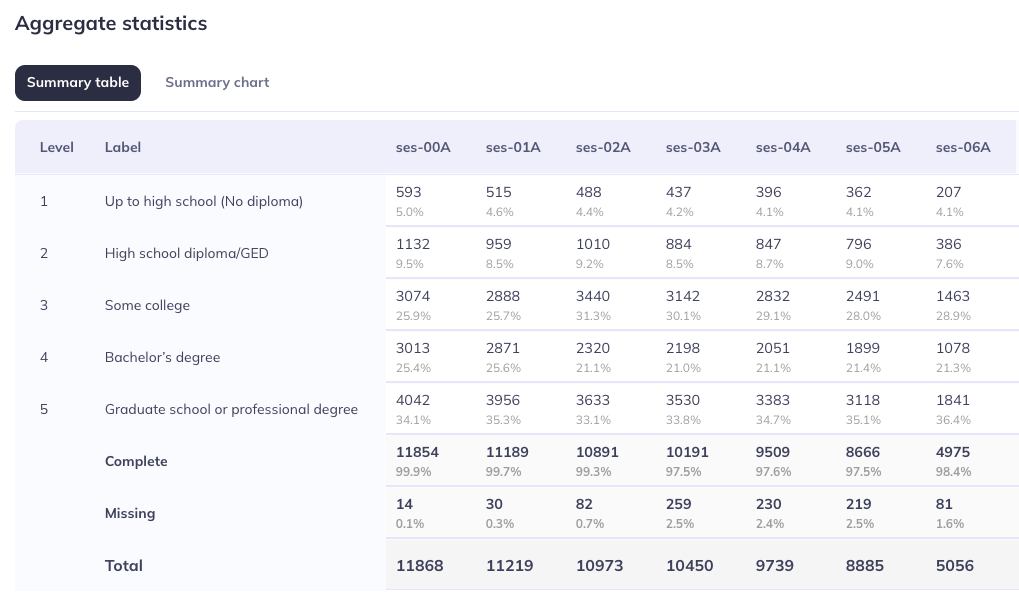
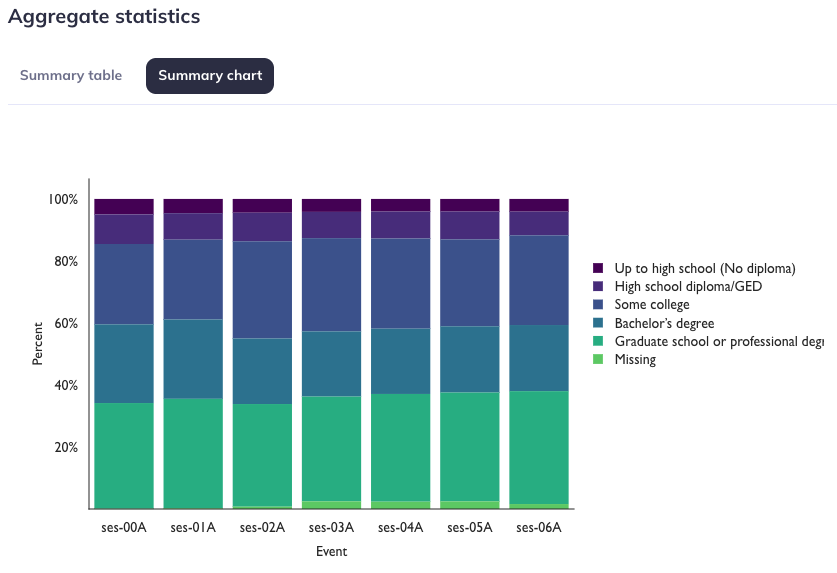
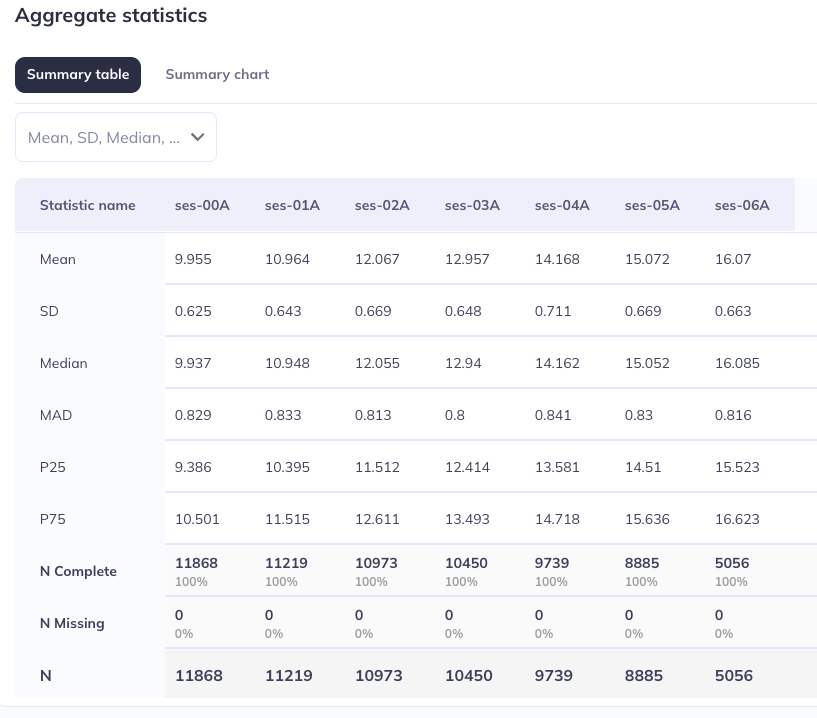
Aggregate statistics
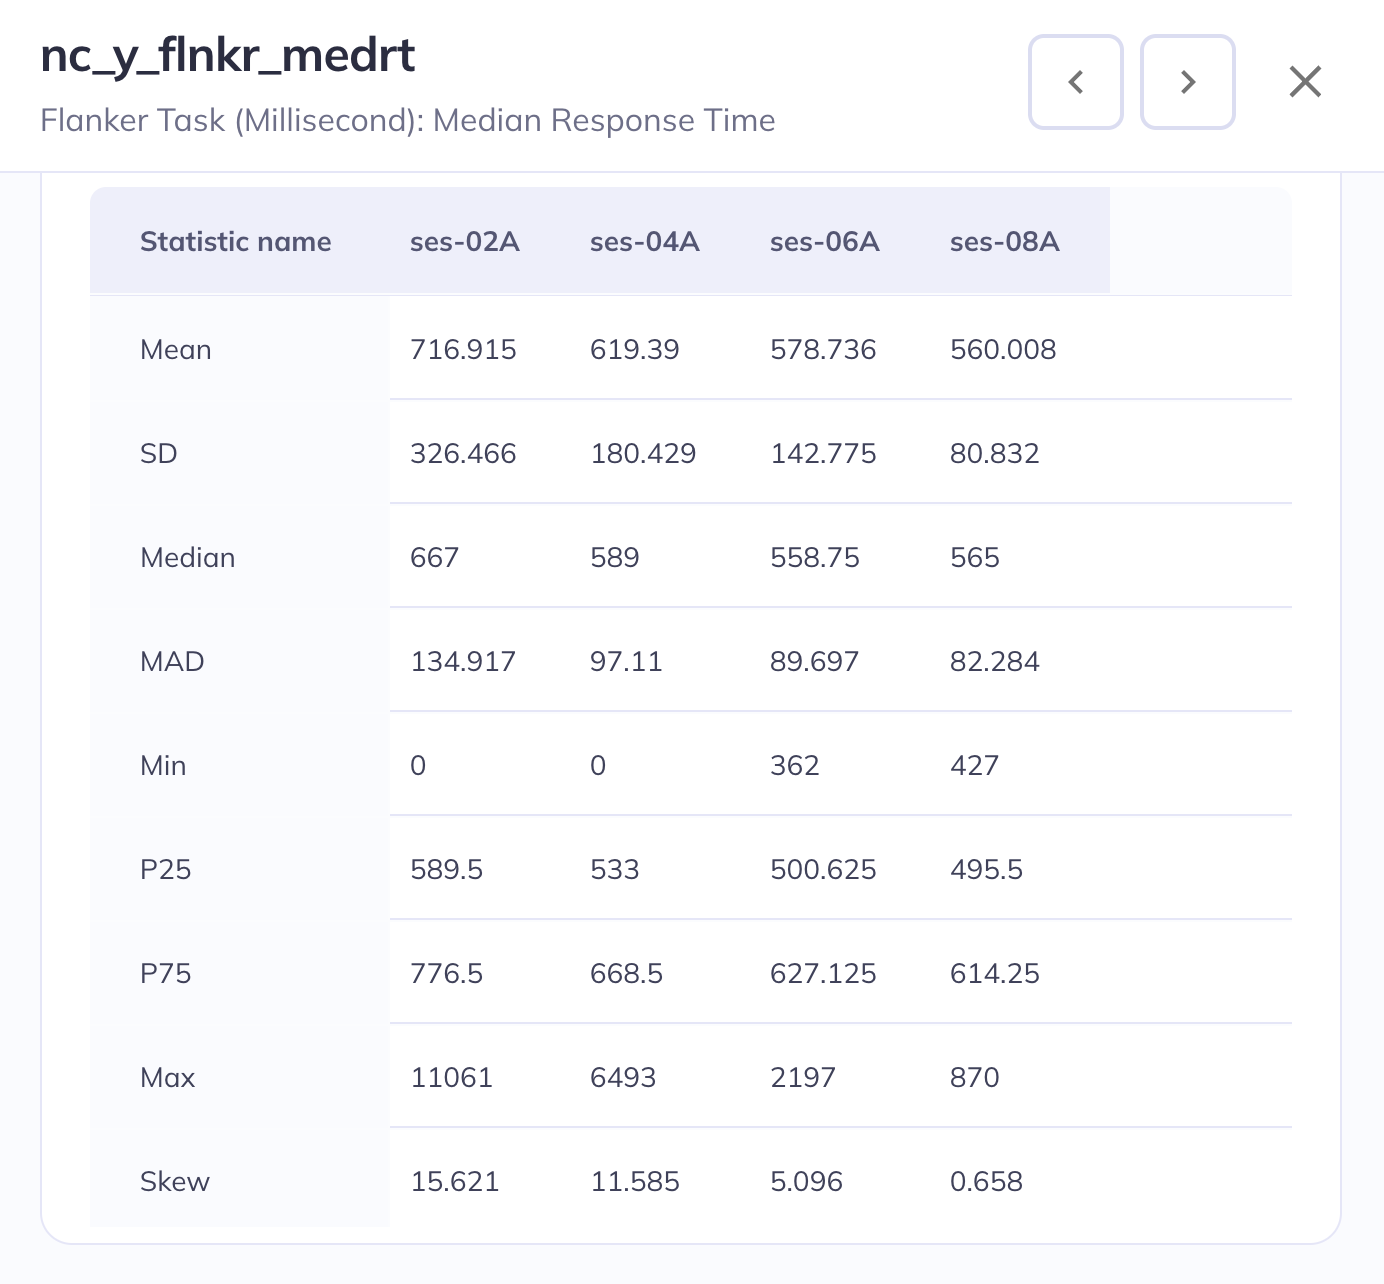
The Aggregate statistics section displays basic descriptive statistics for the selected variable as a table and chart. The Data type dictates what type of descriptive statistics are displayed:
- For categorical variables (
Data type: character), the table lists the frequencies of endorsements for the different response options / levels of the categorical variable as well as overall completeness and missingness counts by event; it also serves as a lookup table for which value in the data refers to which label/meaning. The summary chart displays these data as stacked bar graphs. - For continuous variables (
Data type: integer, double, date, timestamp, etc.), the table lists several basic summary statistics like minimums, maximums, quartiles, etc. as well as overall completeness and missingness counts by event. The summary chart displays the distributions by event using a combination of box plots and density plots. .
Categorical Data type
Continuous Data type
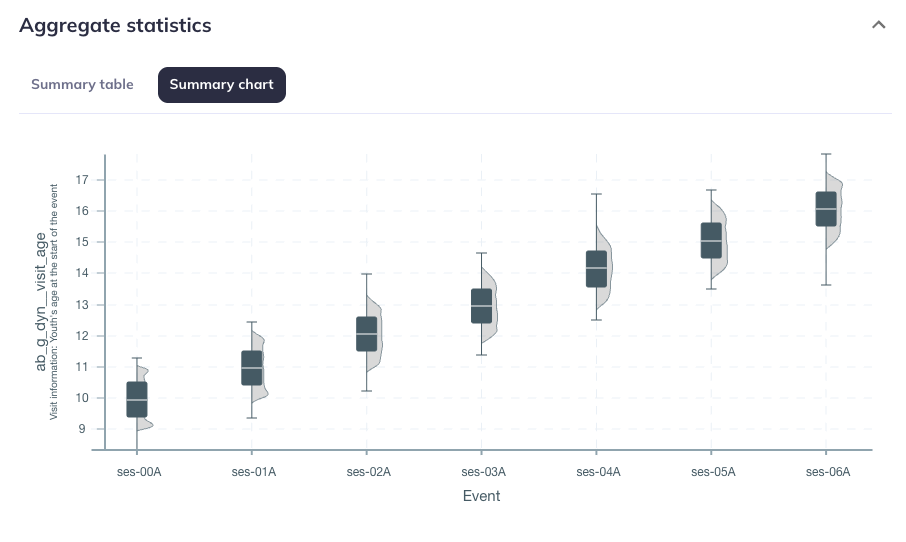
Event naming
The aggregate statistics visualizations only contain the events for which that variable has data at. The visualizations display values only for events where there is data.
For example, the variable to the right only has data for events 2, 4, 6, and 8; so, only those years are displayed in the aggregate statistics table (and chart).
Please note that variables may vary when they are administered independent of the table they belong to. The best way to identify what events data is present at is through the aggregate statistics visualizations or downloading the data.
Event names are provided in the summary table as the name (ses-##) and the label (`#Year). Summary charts display the event name.
Display customization
You have some options to change the display of the summary tables and charts.
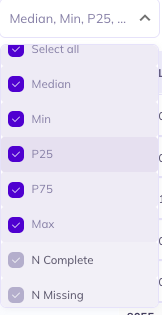
Select statistics: For tables of continuous variables, you can select/deselect which statistical values should be displayed.
- Mean
- Standard deviation (SD)
- Median
- Mean absolute deviation (MAD)
- 25th percentile (P25)
- 75th percentile (P75)
- Skew
- Kurtosis
- n Complete (not hideable)
- n Missing (not hideable)
- n Table/Event (not hideable)
Choose denominator: In the summary table you can choose whether you would like the denominator to be represented as table or event. Choosing table will include any participant who has a value for any variable within that table. If you select event all participants who have any data for that event will be included in the total count. Selections in this tab will also effect the summary chart.
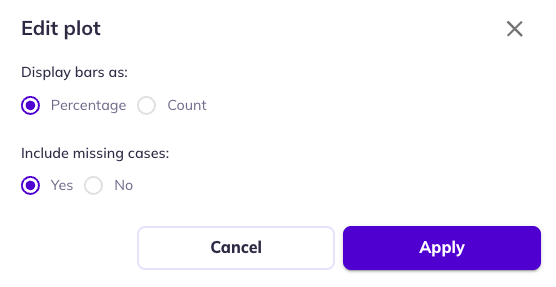
Edit plot: Stacked bar charts (categorical variables) allow you to toggle between percentages and counts as well as to filter out participants who are missing a value for that variable (but are included in the table/event count).
Administrative information
The Administrative information section provides further context about how a given variable was administered, especially for surveys/questionnaires. It includes the headers and instructions that are being displayed to the participants while they’re filling out the survey as well as other details about the variable like the field type (radio, date-time, checkbox, etc), the order of appearance in the form, and the branching logic (also called skip logic) applied to the variable. Some variables may have images if the image was part of the administrative instructions for the participant.
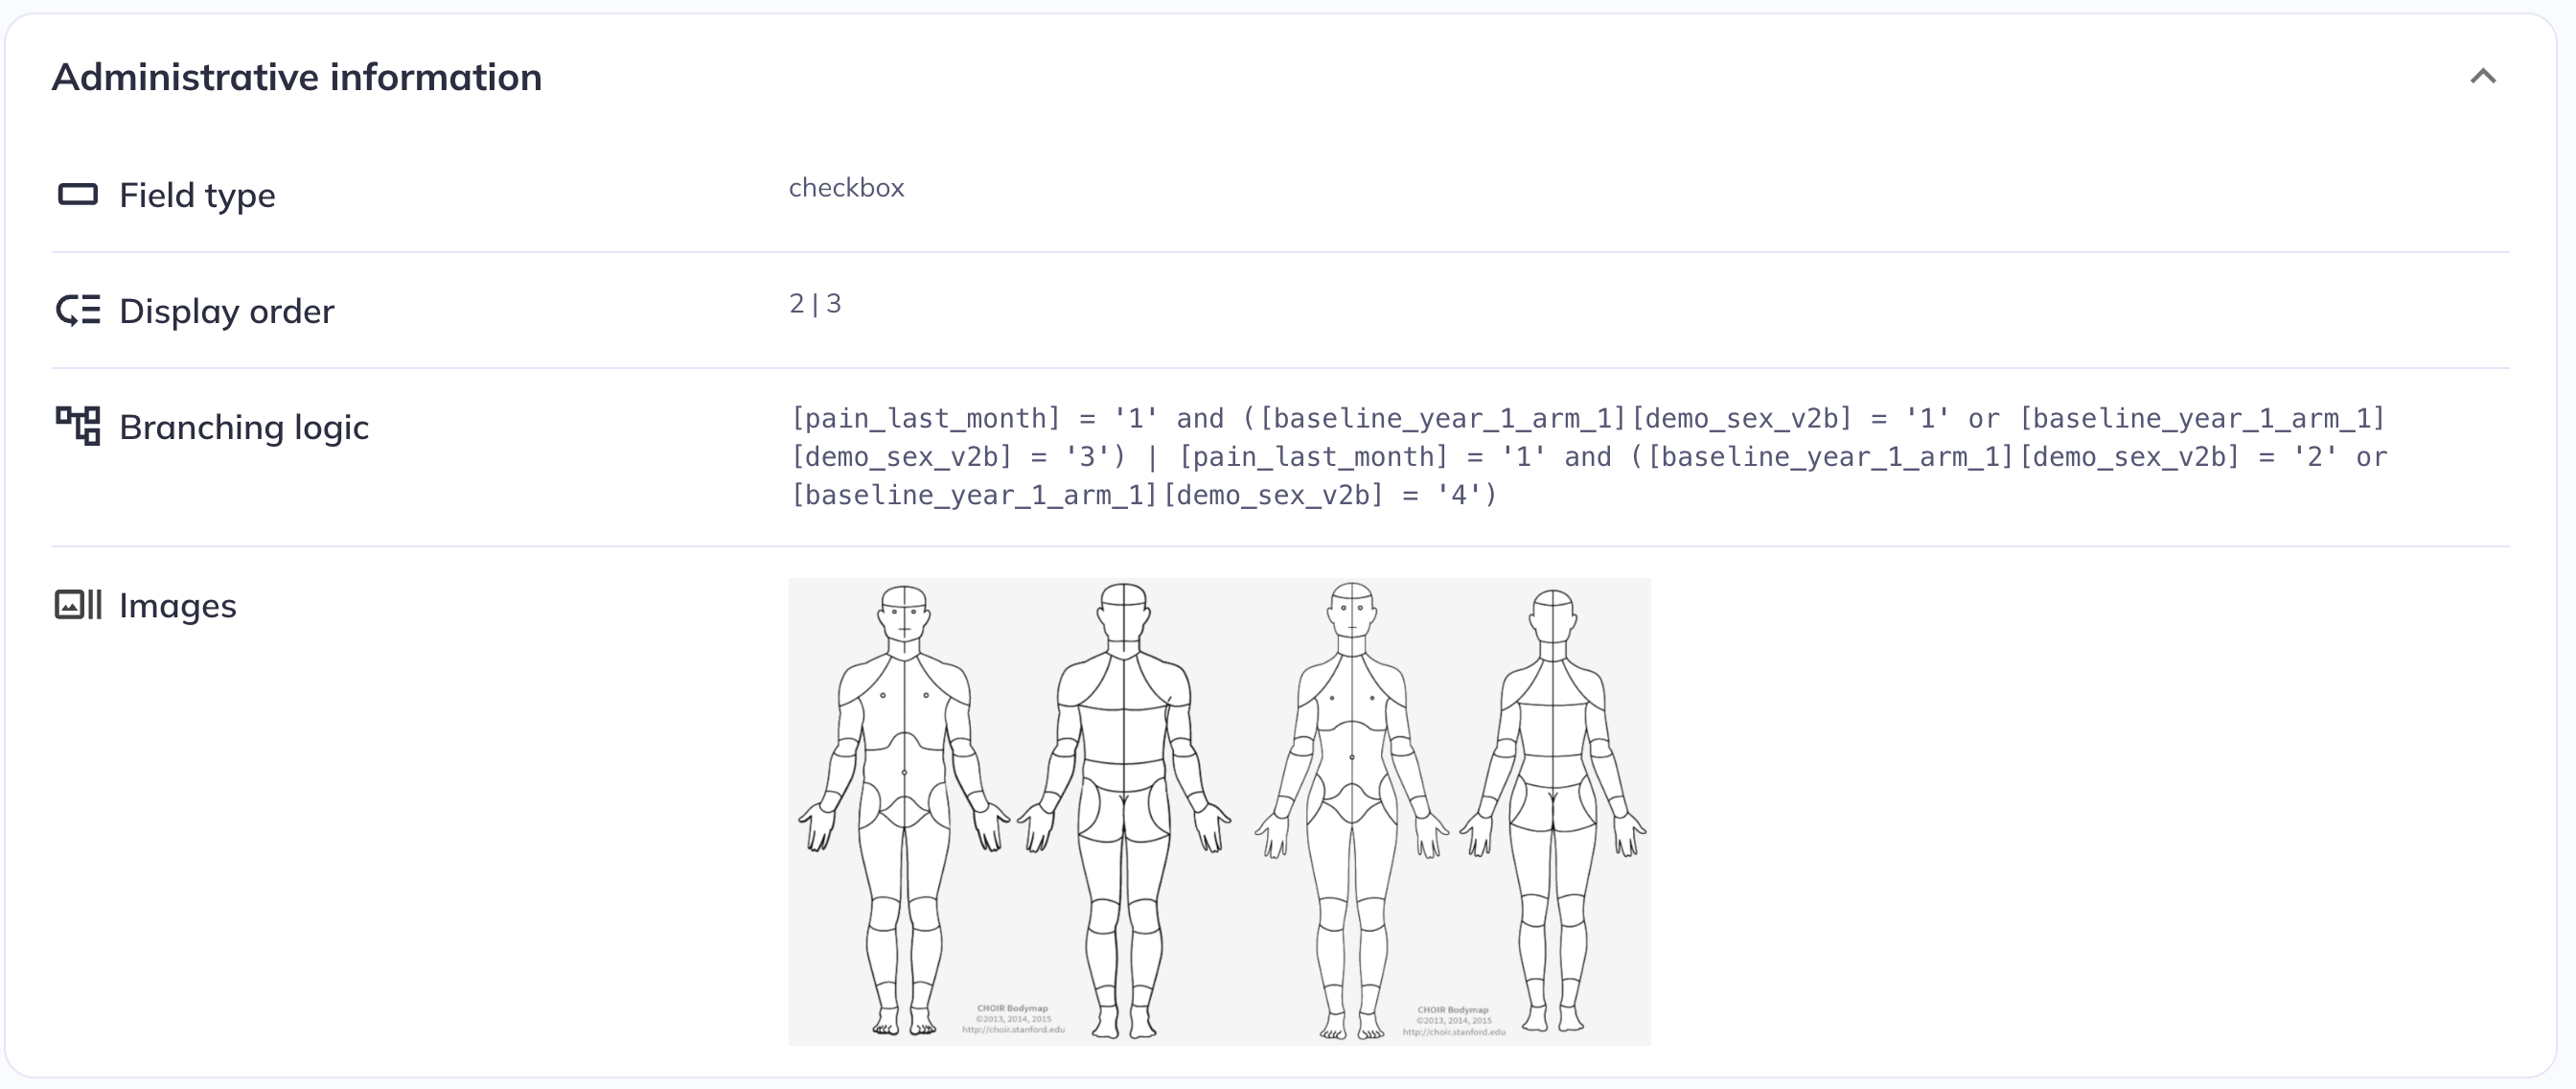
Administrative information for ph_y_pq__abdomen__frntl_001 (ABCD study)
The branching logic is currently provided based on the variable names and syntax used in the study’s electronic data capture system, REDCap (the name mapping section below describes how to look up the REDCap name of a given variable). Future versions of DEAP and the data dictionary viewer will translate the branching logic into the release variable names.
Ontology location
The Ontology section provides the ontology tree nodes that the variable is nested under. This information can be helpful for understanding where variables exist in the ontology tree or sending instructions to others on how to access specific variables.
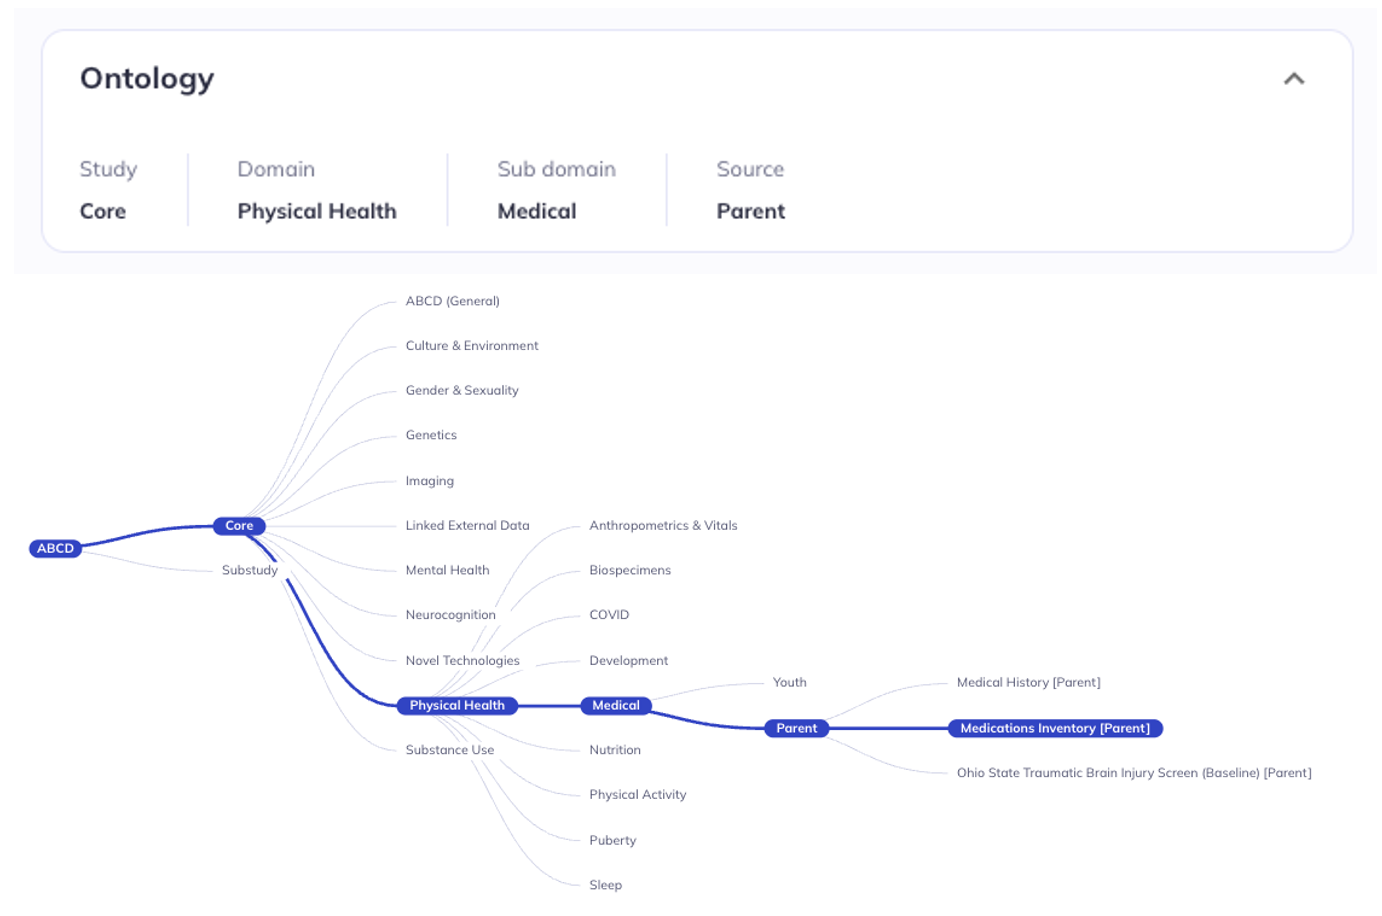
The description in the detail view matches the ontology tree structure
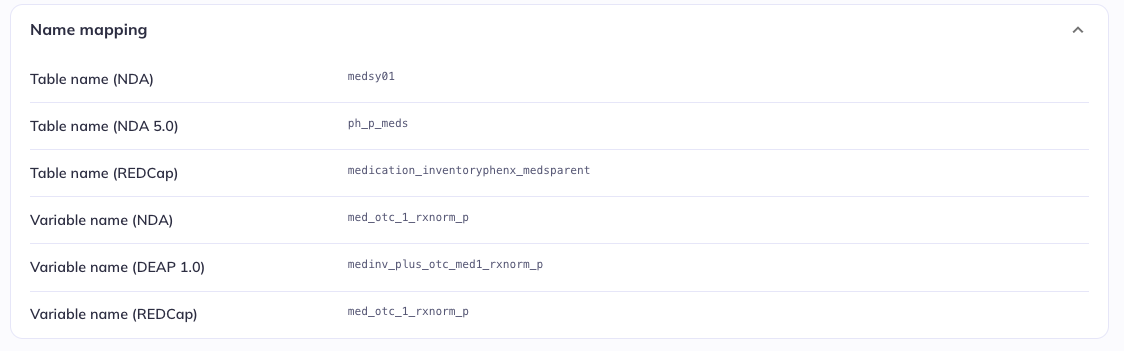
Name mapping (ABCD only)
The Name mapping section provides information about the name(s) a given variable has or what table(s) it is part of in other contexts, e.g., in past releases. The possible options are:
Table name (NDA): The table the variable was part of before the 5.0 releaseTable name (NDA): The table the variable was part of in the 5.0/5.1 releaseTable name (REDCap): The table/form the variable is part of in the electronic data capture system used for the study, REDCapVariable name (NDA): The name of the variable that in previous releasesVariable name (DEAP 1.0): The name of thevariable in the classic version of DEAPVariable name (REDCap): The name of the variable in the electronic data capture system used for the study, REDCap
Only the elements that are relevant for a given variable are displayed (e.g., if the variable is released for the first time in the 6.0 release, the names for previous releases will be missing, etc.). This information is provided to allow users to relate the tabulated data from the new curation implemented for the 6.0 release to previous versions.
As a reminder the branching logic in administrative information uses the REDCap names, visible in this section.