Data dictionary explorer
The data dictionary explorer consists of two elements; the ontology tree and data dictionary table.
The Ontology Tree provides a flexible, hierarchical view of study measures, organized by categories such as Domain, Subdomain (ABCD only), and Source (informant), etc. It allows users to visually navigate the relationships between tables and narrow the scope of variables displayed in the Data Dictionary Table.
The data dictionary table offers a searchable, filterable, and customizable interface for exploring individual study variables and their associated metadata. You can browse it independently or in conjunction with the ontology tree. Together, these tools make it easier to identify, filter, and select variables of interest—supporting efficient and intuitive dataset exploration.
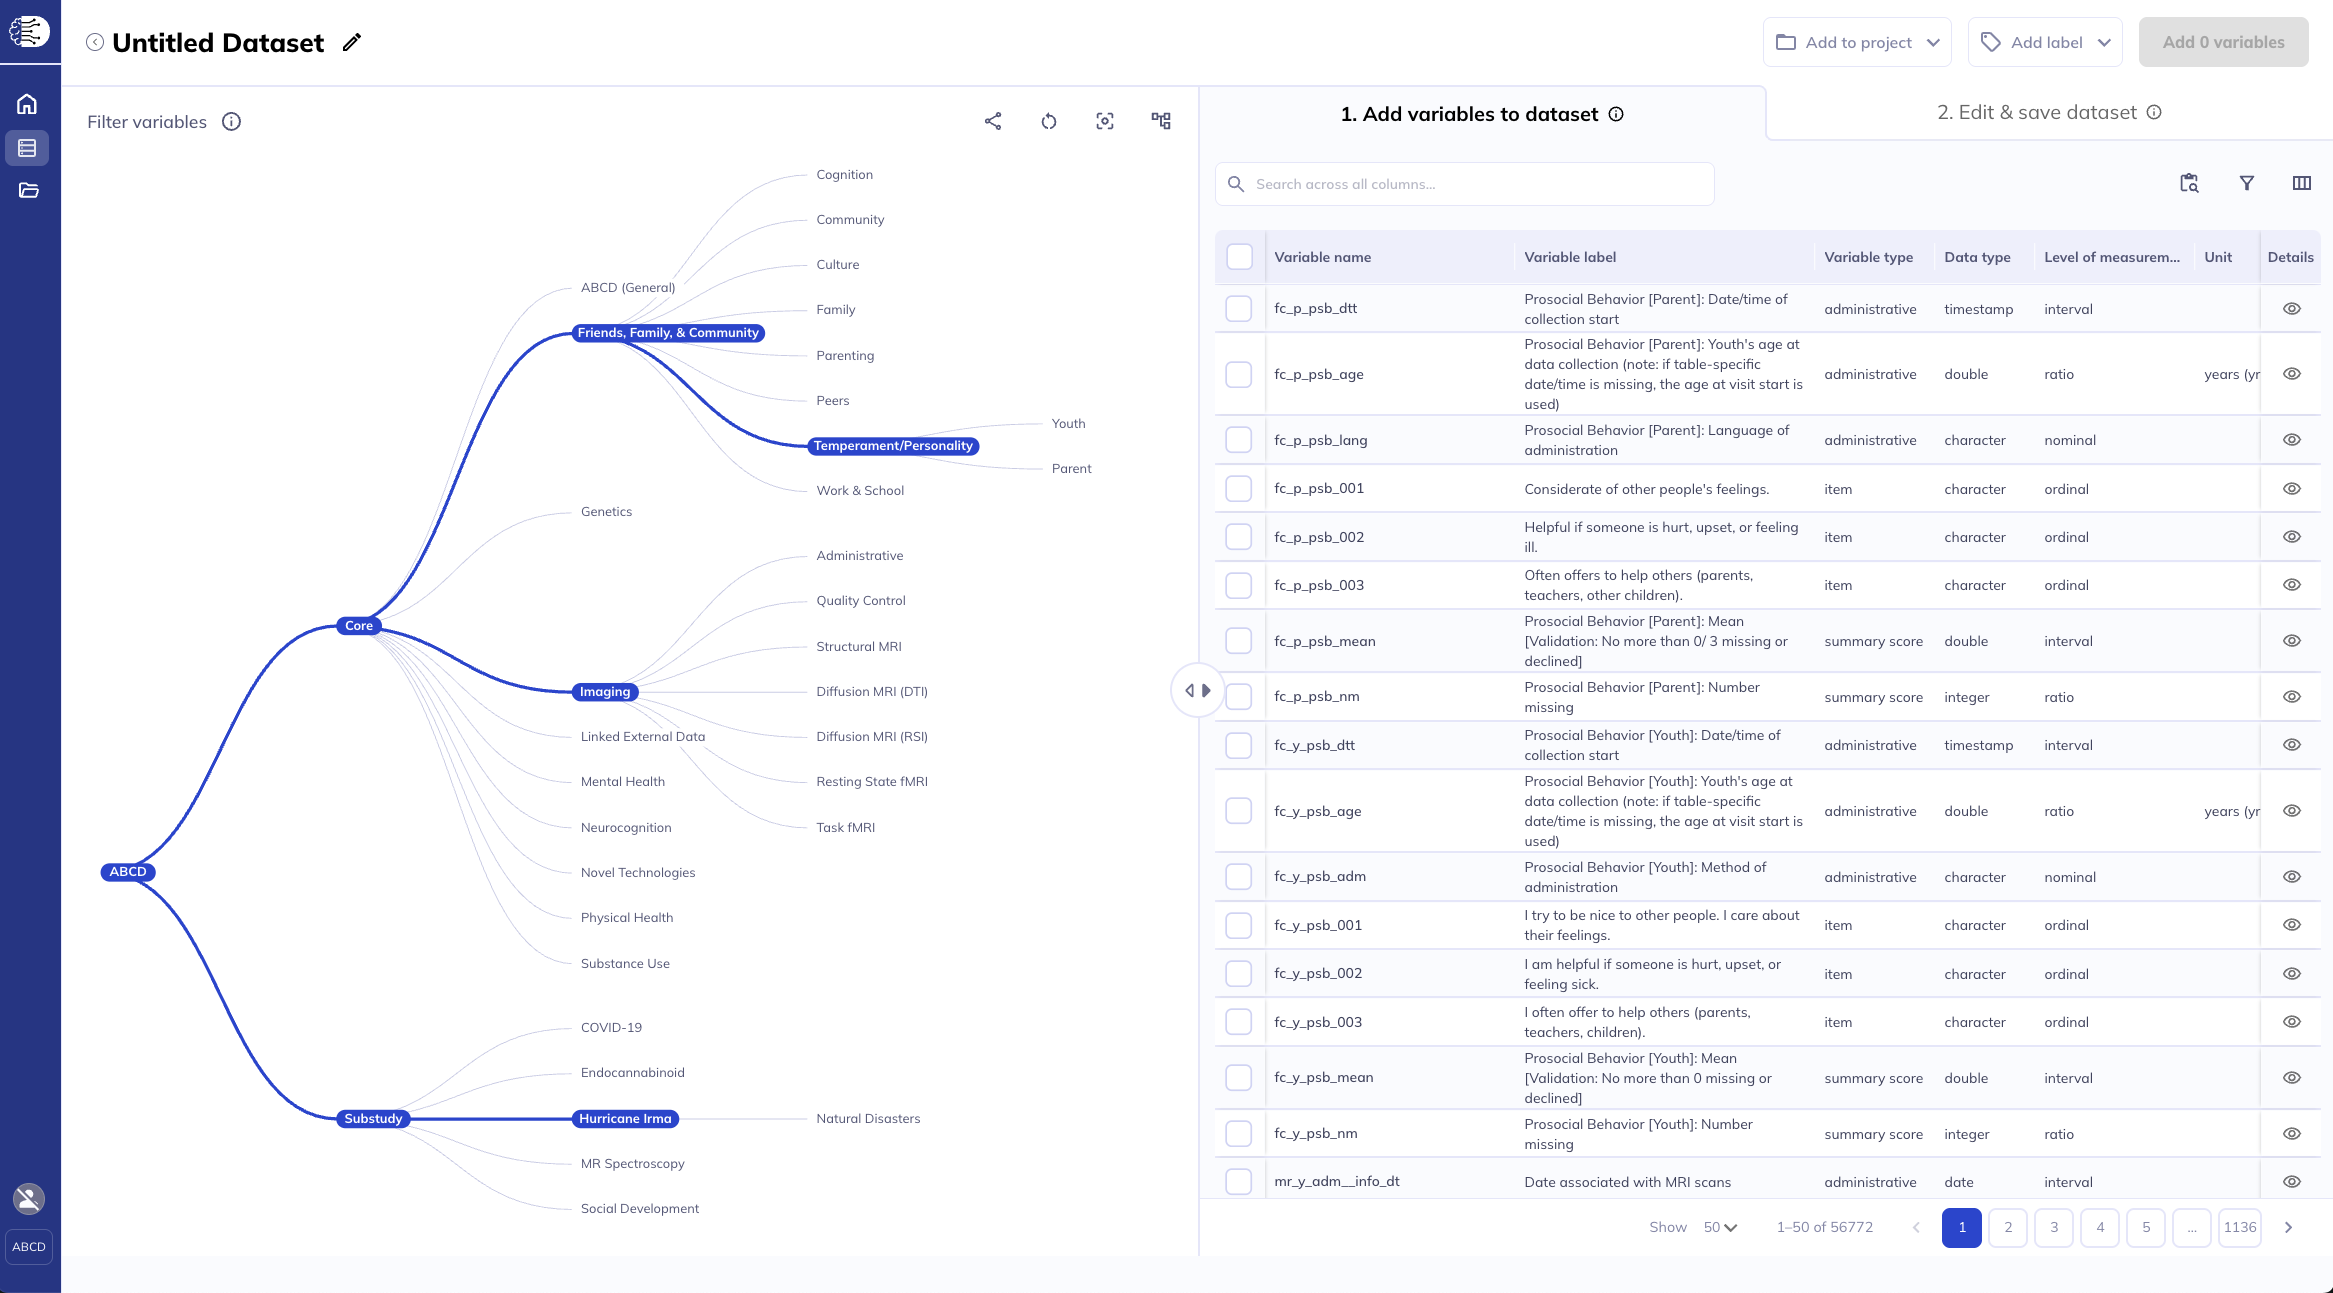
Ontology tree (left) and the data dictionary table (right)
Anyone can use the ontology tree and data dictionary to learn more about the ABCD and HBCD study. Only users with valid Data Use Certification (DUC) can create datasets. If you do not have a valid DUC, you will not be able to select variables and create a dataset.
Ontology Tree
Tree - Data dictionary relationship
The tree-based ontology browser organizes the database tables hierarchically by assessment domain, subdomain, and other properties. The tree allows you to explore the data organization and provides a high-level overview of research areas.
To change how much horizontal space is allocated to the ontology versus the data dictionary table, you can drag the divider between the two to either direction. To completely hide one of the elements, click the corresponding arrow in the middle of the divider.
Drag the ‘arrow’ to emphasize the ontology-tree or the data dictionary
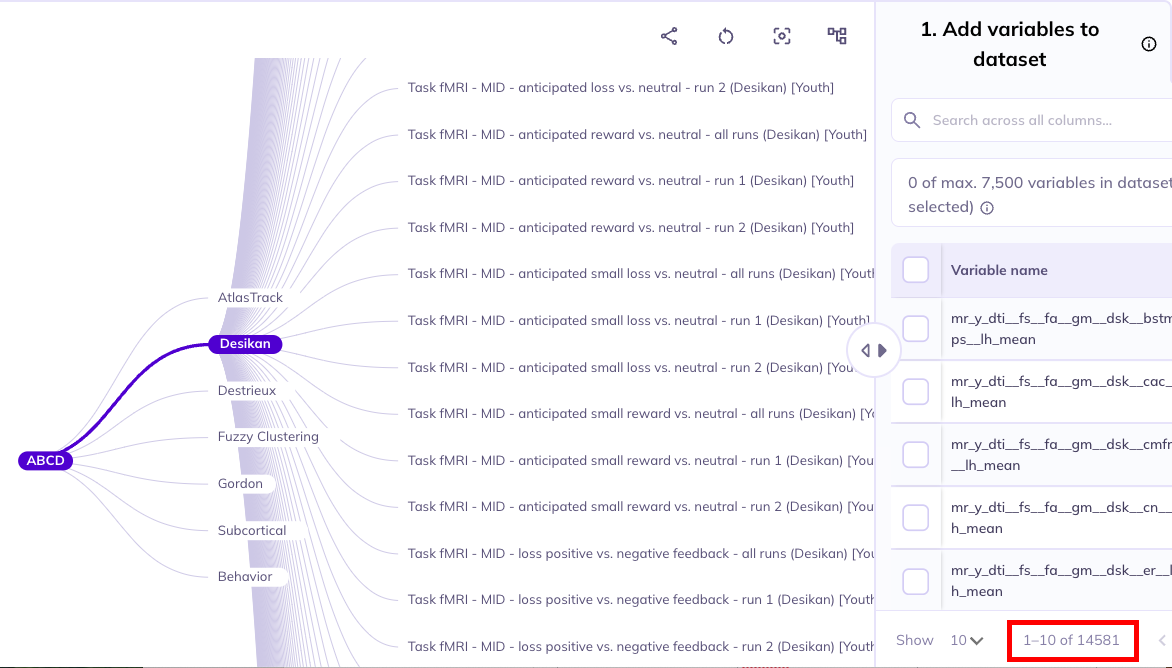
Selections made in the ontology tree act as a filter on the Data Dictionary Table; they reduce the variables displayed in the table to focus it on your selected subset of variables, making their exploration more efficient. By default, the ontology’s root node is selected; as such, the table will include all variables in the ABCD tabulated data resource. Selecting nodes on lower levels of the ontology will narrow the scope of variables included in the data dictionary table. If a node is selected, all measures at that level and below will be included in the table.
The data dictionary table reacts to the ontology tree selections
Ontology display
Navigation
To move around the ontology tree click on the levels you want to open. You can drag the ontology tree around the viewing screen by clicking and dragging. To zoom in/out on the tree pinch and pull in/out with your fingers. With a mouse, you can zoom by scrolling the wheel in or out. If you loose the location of the ontology tree you can click reset () or pan around by clicking until you find it.
Click and drag to pan/move the tree, pinch/scroll to zoom

Display
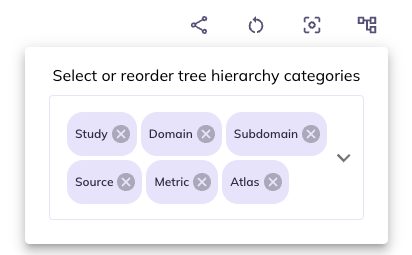
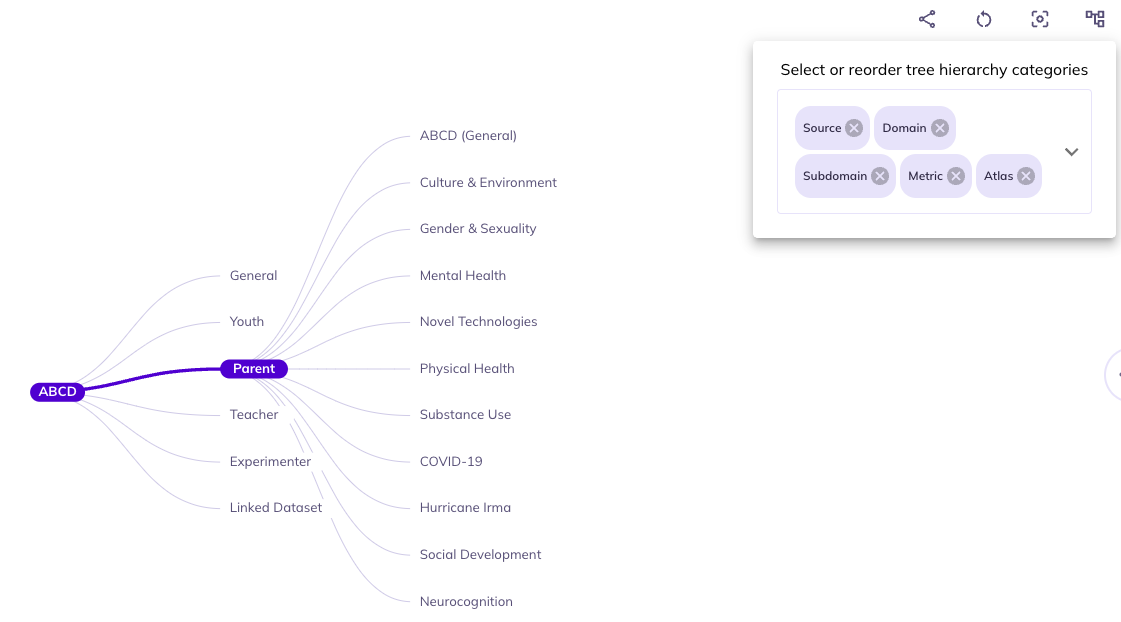
Structure (): You can limit and re-order the ontology tree by selecting . Dragging categories will change the hierarchical order the categories appear in the ontology. Un-selecting a category will remove it from the ontology tree. You can re-select removed categories using the same widget.
If you are interested primarily in data reported by the parents and don’t have an interest in differentiating between the core protocol and substudies you would unselect Study and drag Source to be first in the ontology. This will reduce your need to click into the core protocol and substudies to find the parent surveys.
In some contexts certain categories are redundant.For example, data in the imaging domain is only collected from the youth participants Source. As such, you could remove Source to cut down categories to navigate through.
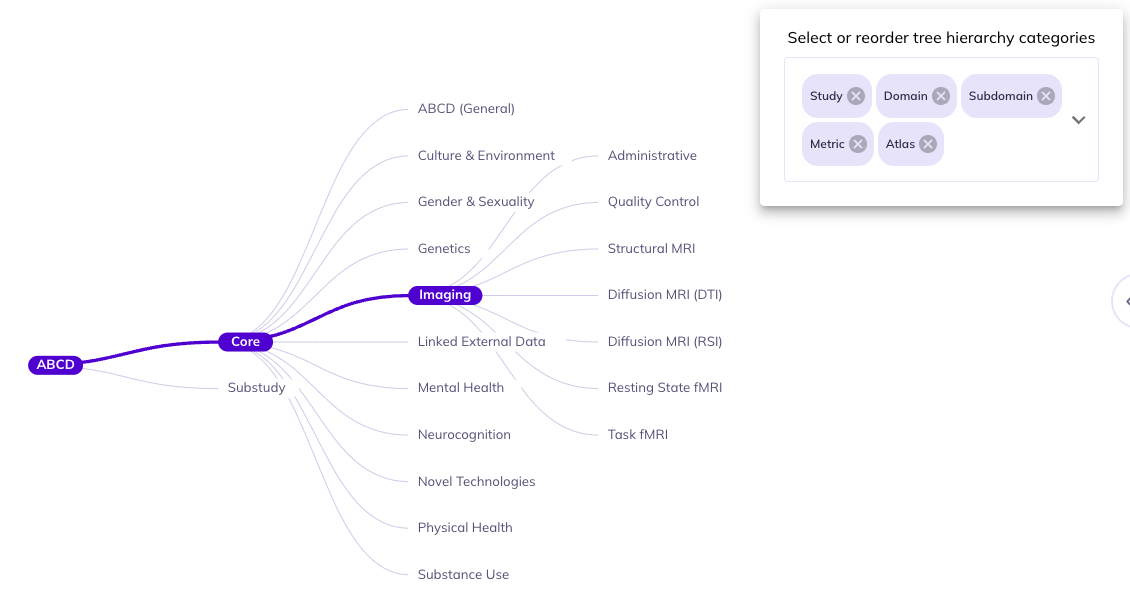
If you want to focus on imaging data from a specific brain atlas (e.g., the Desikan atlas), you might choose to eliminate all categories besides Atlas since everything would be nested under the Core, Study, Imaging, Youth, etc. This would allow you to fast track your selections in the data dictionary table.
Some subdomains exist across multiple domains. You can remove Domain to explore variables from subdomains that exist in different domains.
Focus mode (): Sometimes the ontology tree can become difficult to overlook. You can simplify the tree by focusing only on the path of your current selections and hiding all extraneous elements. Select the focus mode button: to enter focus mode. As you click down the ontology you can re-focus by reselecting . To exit focus mode you can click , located at the root of the focused ontology tree.
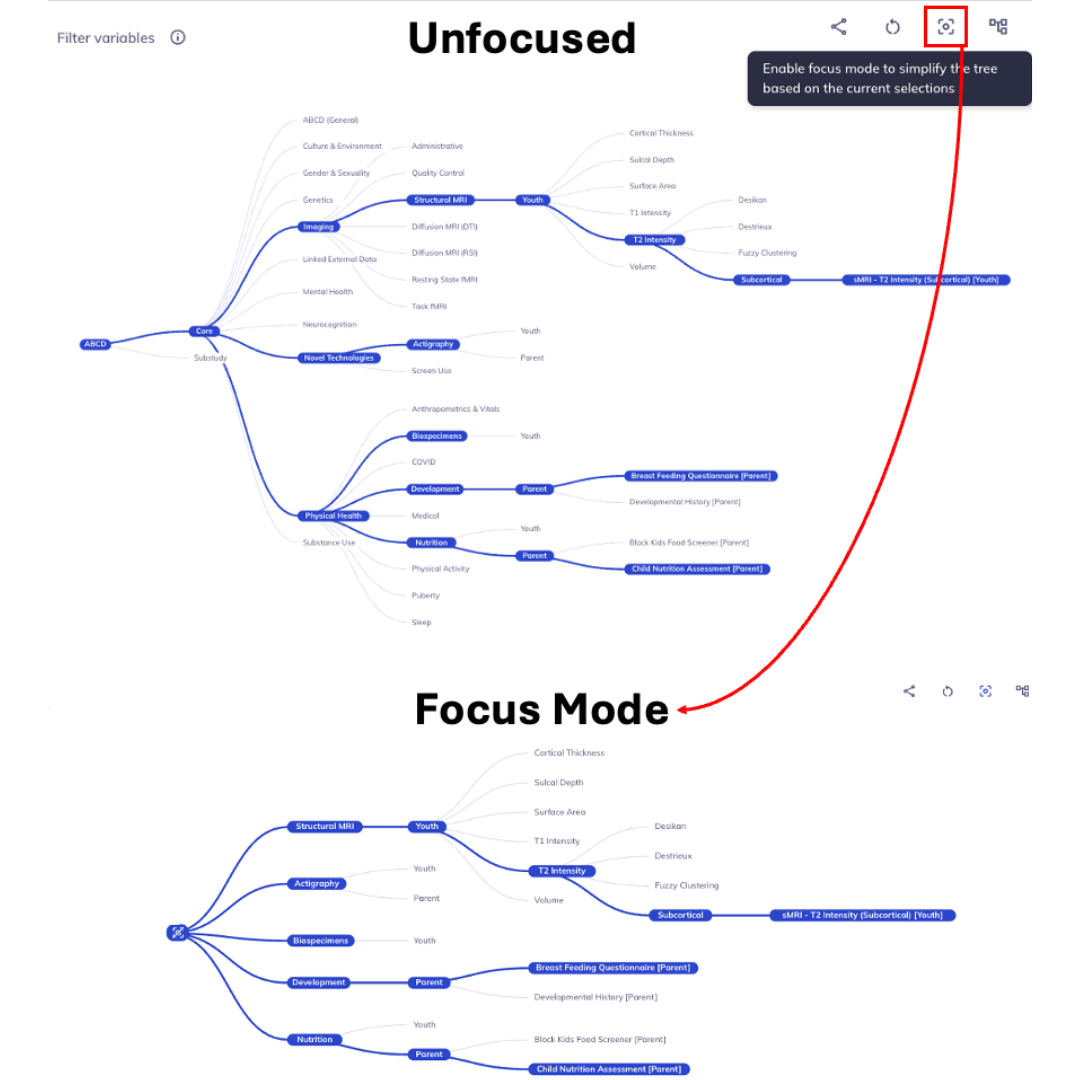
Focus mode removes unselected levels; click the root node to unfocus
Reset the tree (): You can remove selected categories from the ontology tree by re-selecting hierarchically higher categories. Re-selecting the node of a category will hide any selections downstream of it (e.g., clicking Domain will hide Subdomain, Source, etc.). Click Core and/or Substudy to collapse the whole tree branch.
The entire ontology tree can be reset by clicking the reset button: . Any selections, restructuring, or modification of the tree will be undone.
Select upstream levels to collapse content, select to reset the tree
Ontology structure
By default, the ontology tree has the following levels (in the following order):
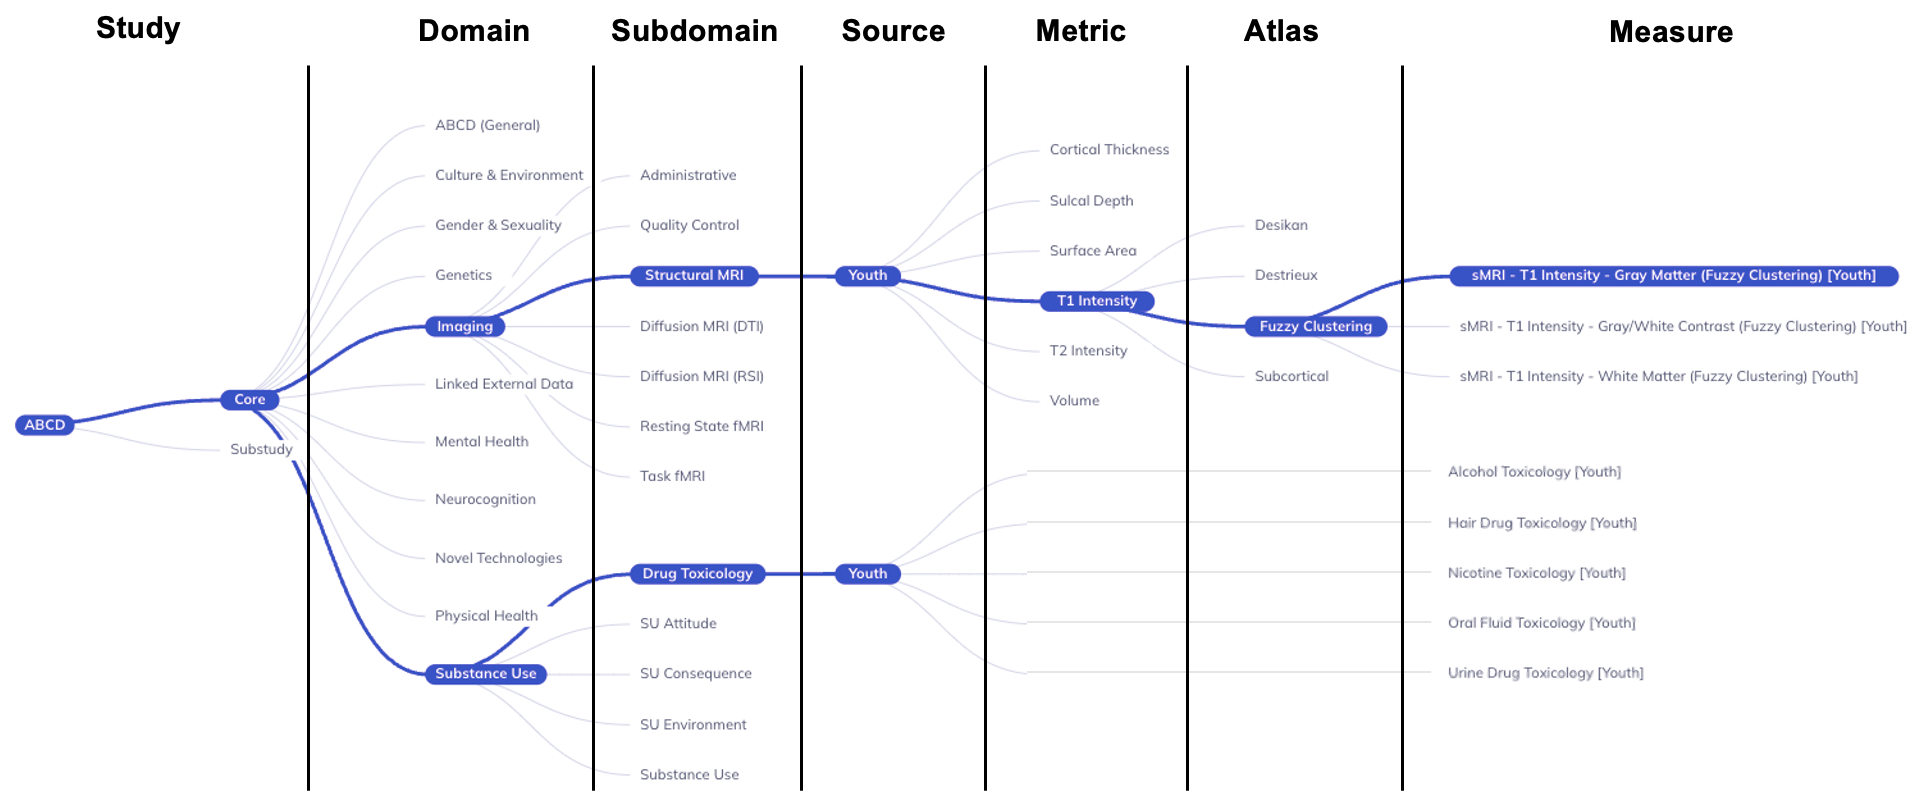
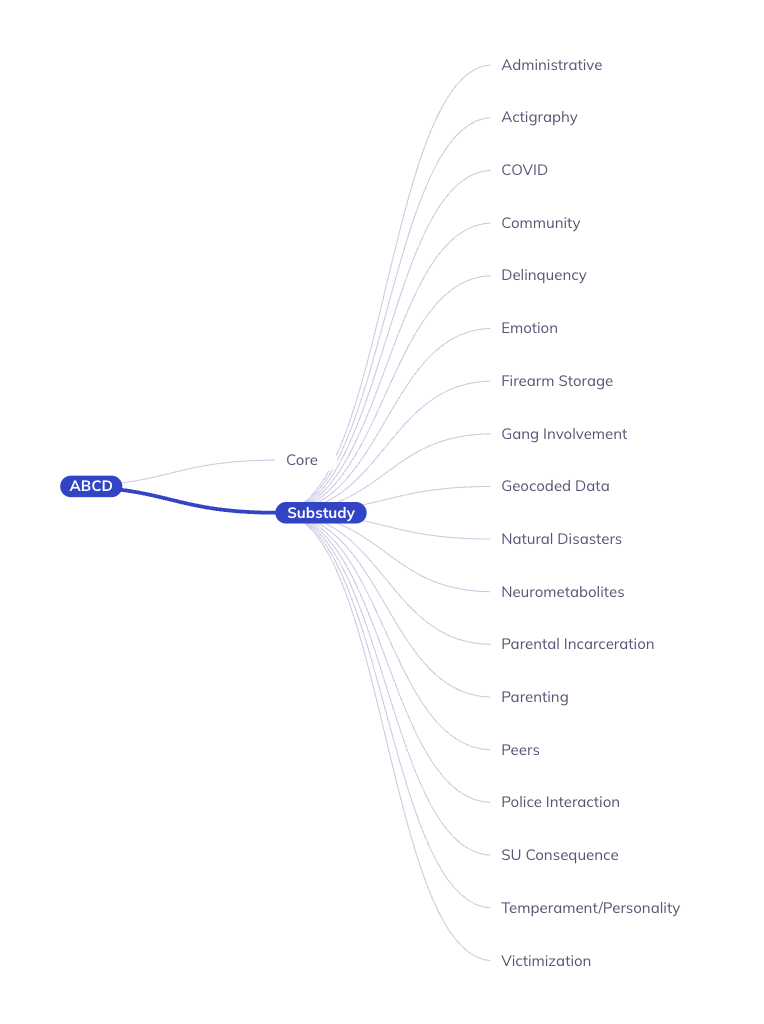
Study: ABCD + Core/SubstudyDomain: Largest grouping of protocol by subject matterSubdomain: Topic of table, can exist across multiple domainsSource: Who provided the dataMetric(imaging only): Derived measures of brain structure or functionAtlas(imaging only): Standardized map of regions of interest (ROI)Measure/Table: Collection of variables with a close relationship of subject matter
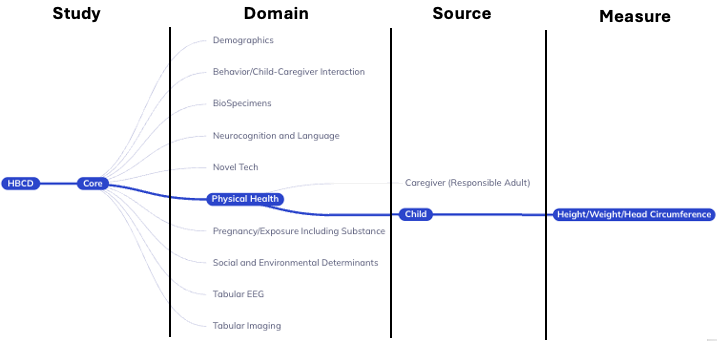
Study: ABCD + Core/SubstudyDomain: Largest grouping of protocol by subject matterSource: Who provided the dataMeasure/Table: Collection of variables with a close relationship of subject matter
To come in future waves:
Metric(imaging only): Derived measures of brain structure or functionAtlas(imaging only): Standardized map of regions of interest (ROI)
Data Dictionary Table
The Data Dictionary Table (right side of Create a dataset) provides an interactive way to filter your variables & meta-data of interest. The table allows you to build on the filtering provided by the ontology tree does through the filter & search functions. Additionally the data dictionary table has flexible display options, including controlling the data dictionary meta-data that is displayed and adjusting the tables appearance (rows displayed, column order, width, etc).
The data dictionary table is also where you will create datasets and modify existing datasets
Table display
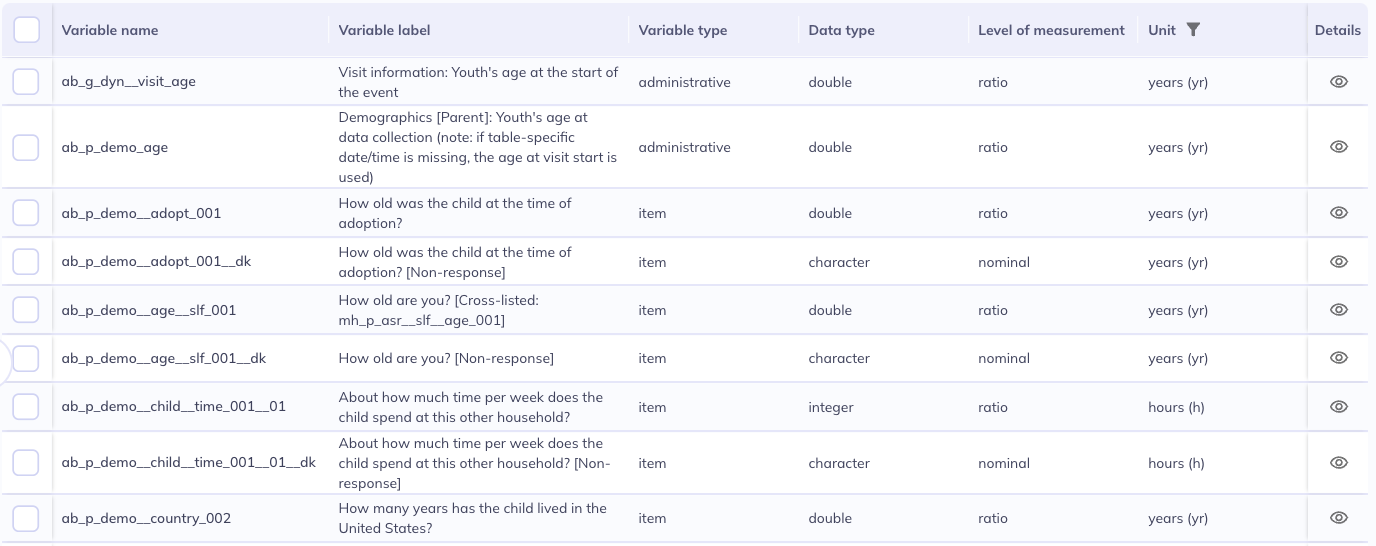
By default, the data dictionary table displays the following columns:
Variable nameVariable labelVariable typeData typeLevel of measurementInstructionsUnit
For more information on ABCD’s data dictionary visit their documentation website.
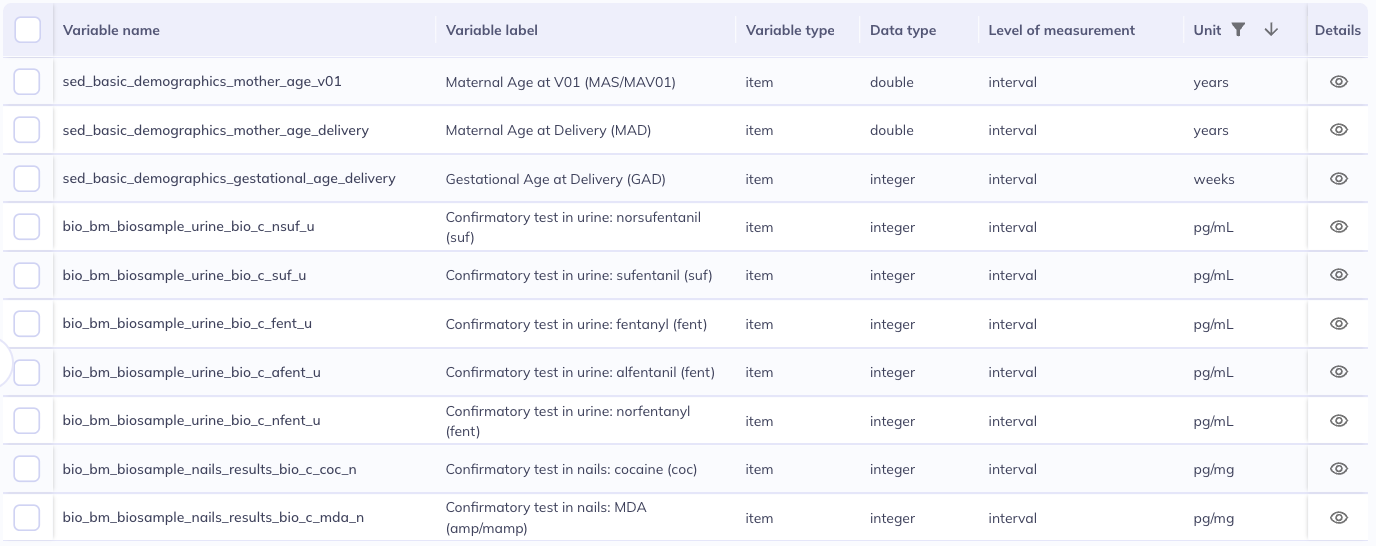
Variable nameVariable labelVariable typeData typeLevel of measurementUnit
For more information on HBCD’s data dictionary visit their documentation website.
Column display (): To change which columns are displayed, select located at the top right of the table. In the widget you can toggle columns on or off individually or show () or hide () all columns at once using the buttons at the top. You can reset to default settings by clicking the reset button ().
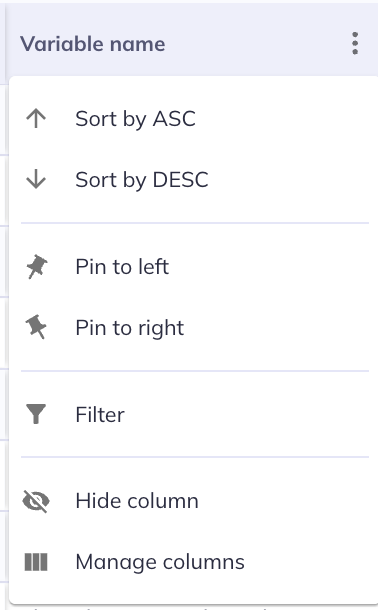
You can make further changes to the appearance of the data dictionary table by clicking the next to each column header. In the column menu you can:
- Sort the column (ascending / descending )
- Pin () the column to the left or right to stabilize their view as you scroll horizontally. Pinned columns will appear in the order selected; the column pinned first will appear the furthest out in the selected direction.
- Filter () the column (learn more about filtering below).
- Hide column will hide the column (it will also unselect them in ).
- Manage columns is another way to view the menu for selecting/deselecting the displayed columns.
Other ways to modify the table display:
- Click the arrows ( / ) next to each column header to sort ascending or descending. This can also be done in . To sort by more than one column, click on the first column, then hold your system’s modifier key (cmd on a Mac; ctrl on Windows/Linux) and click on the second (and potentially further columns).

Ordering the Variable name column in alphanumeric fashion may not best represent the logical progression of variables. Use of the Sort ordercolumn is often more useful for seeing the order variables are displayed in.
The data dictionary table is sorted by Table name and Sort order column by default and Sort order best represent the variables in the order they were displayed to participants or a more logical progression (such as grouping administrative variables together).
In some tables, Sort order is equivalent to the variable’s alphanumeric order, but in most tables the Sort order has been set manually for a more intuitive display.
- Use the sliders () to the right of each column to change the column’s width.
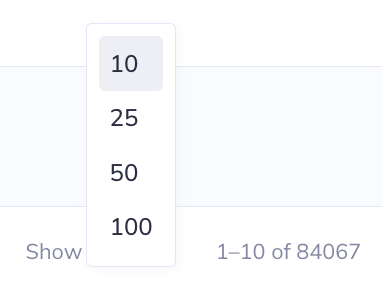
- At the bottom of the table, you can adjust the number of variables that are displayed on one page (10, 25, 50 or 100 rows; default: 25). Use the button with the page numbers or the arrows to navigate to different table pages.
Filtering
This section will cover how to effect what is included in the data dictionary table that is displayed. As a reminder the ontology tree can be used to adjust the variables included in the data dictionary.
The selection in the ontology tree are applied before the search function or filtering. Filtering also takes precedence over the search function. That is, the search function will only search among the variables that are displayed in the table given the sections in the ontology tree or filters.
Order of priority: Ontology Tree > Filter > Search
To learn more about the data dictionary meta-data and to better understand the full scope of information on each variable please visit each studies documentation:
Filter
Variables names are structured to provide you with information about the domain, source, measure, and question order. Understanding the variable name structure for the study can aid in sorting.
Available filters
- contains
- equals
- starts with
- ends with
- is empty
- is not empty
- is any of
The ontology tree acts as the primary filter of the data dictionary table but you can also filter the table itself. To specify column-specific filters, select () at the top-right of the table or in the column settings (). Selecting to filter from a variable column will default the filter to be based on that column. You can only filter on columns that are actively selected for display. Filters can be modified and/or removed within the same pop-up ().
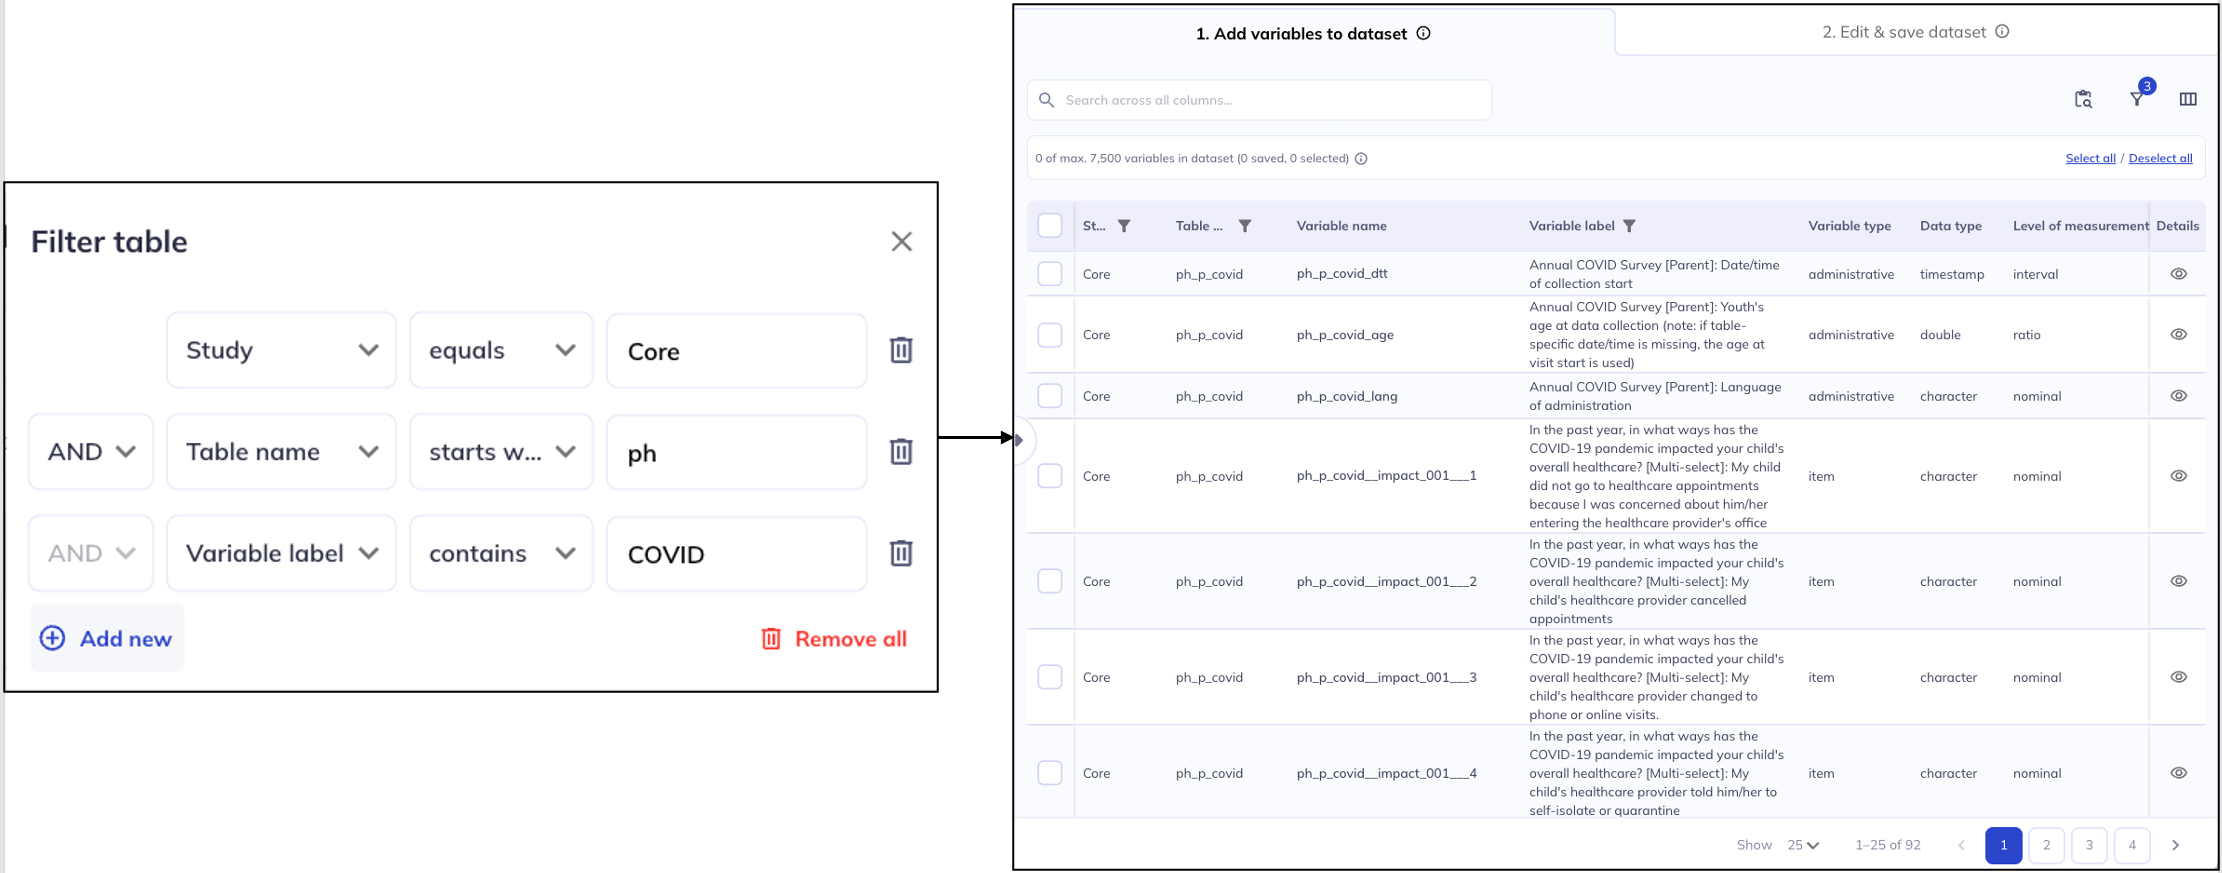
The filter function will only work on the variables that are currently listed in the table, i.e., after the selections in the ontology tree have been applied. Searching for [Table name] [starts with] [nt] will not bring up variables from the Novel Technology domain if you have already used the ontology tree to filter the data dictionary table to only include variables from Physical Health.
All the categories of the ontology tree are also columns in the data dictionary so you can also filter on those columns instead of using the ontology tree. Some examples of these types of filters are:
- [
Domain] [contains] [Health] - All variables in the ‘Physical Health’ or ‘Mental Health’ domain - [
Source] [equals] [Parent] - Only parent variables - [
Atlas] [is not empty] - Only variables with a defined ‘Atlas’, which by default will limit to only imaging variables
Example from ABCD dataset
Table names are structured to tell you the domain, source, and measure. If you know the abbreviation for these you can filter by any of those criteria using the ‘Table name’ or ‘Variable name’ column.
- [
Table name] [contains] [le_l_] - Limit the search to variables where ‘Linked External Data’ is the source and the data belongs to the main ABCD study. - [
Table name] [starts with] [nt] - Display variables in the ‘Novel Technology’ domain - [
Table name] [equals] [nc_y_lmt] - Variables related to the Little Man neurocognitive task
Example from ABCD dataset
Searching by keywords in the Domain, Subdomain, or Variable label columns can be a good way to explore the variables if you don’t know exactly what you are looking for.
For example, searching for [Variable label][contains] [sleep] may give you a better idea of where to start looking for sleep-related variables or may tell you about measures you did not know about that also cover sleep.
To learn more about effectively using keywords read about the study glossaries:
- ABCD: https://docs.abcdstudy.org/latest/
- HBCD: https://docs.hbcdstudy.org/latest/
Search
The search function works across all columns in the data dictionary table, even if they are not actively displayed in the data dictionary table. For example, even if the Name (REDCap) column is not displayed, the search function will still search for matching terms in that column. Similarly variables (rows) not on the currently viewable tab of the data dictionary table will still be searchable
Search terms do not need to contain the full term. For example, you can search bisbas__bas_001 or mh_y_bisbas__bas__dr_001.
The search function is not case sensitive but, when searching by variable name, it will be sensitive to spelling and the number of underscores ( _ ) between terms.
Multiple search terms can be used by separating terms with a space; “harm mh_y” will search for columns that contain harm AND mh_y.
Variable details
On the right of each row in the data dictionary table, you can find an eye icon: . Clicking on this icon opens the details view for the respective variable. The details view contains a visual display of that variable’s key meta-data.

- Variable name & label
- Header
- Variable warnings
- Aggregate statistics
- Administrative information
- Ontology location
- Name mapping
- English - Spanish toggle
- Advance through variables
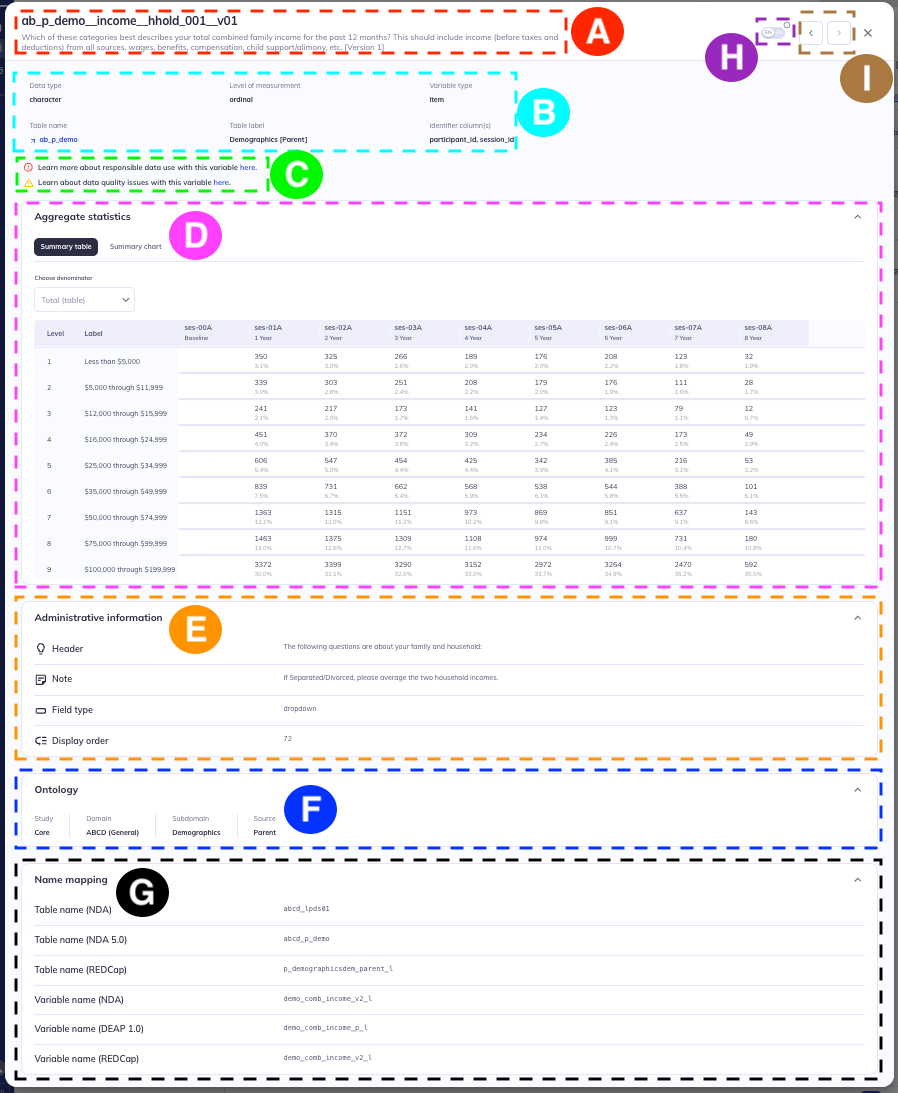
The details view is a more visual display of much of the information in the data dictionary table. Some components, like the aggregate statistics, are only available in the details view. Not all sections within the details will be shown for every variable; the displayed information depends on the relevance to the variable.
Additional display modifications:
- You can toggle forward and backward through all variables that are displayed on the current page of the data dictionary table using the buttons.

- The language toggle switch (English & Spanish) next to in the top bar allows to switch certain elements between English and Spanish. The toggle will only be present for relevant variables; generally where the source is ‘parent’. The toggle will only switch text that was displayed to the participants (e.g., variable label, instructions, headers, response options, etc.).
The toggle will not translate the DEAP platform, just the display instructions & responses for the participants.
- All variable detail sections can be collapsed/expanded by clicking on the section headers or on .
Header
The header lists the Variable name and Variable label. The grey bar below the header lists meta-data including Data type, Variable type, Units (if relevant), Table name, Table label, and Identifier columns (participant_id, session_id, etc).
Some components of the header may contain hyperlinks to external resources. The Table name links to the relevant study documentation about that measure. If a variable has Data warnings, there will be indicators in the details view header & links to the study documentation on those warnings. Variable type may link to R packages with the documentation for the computation the of respective summary scores.
Please review the documentation on data warnings in DEAP for each study.
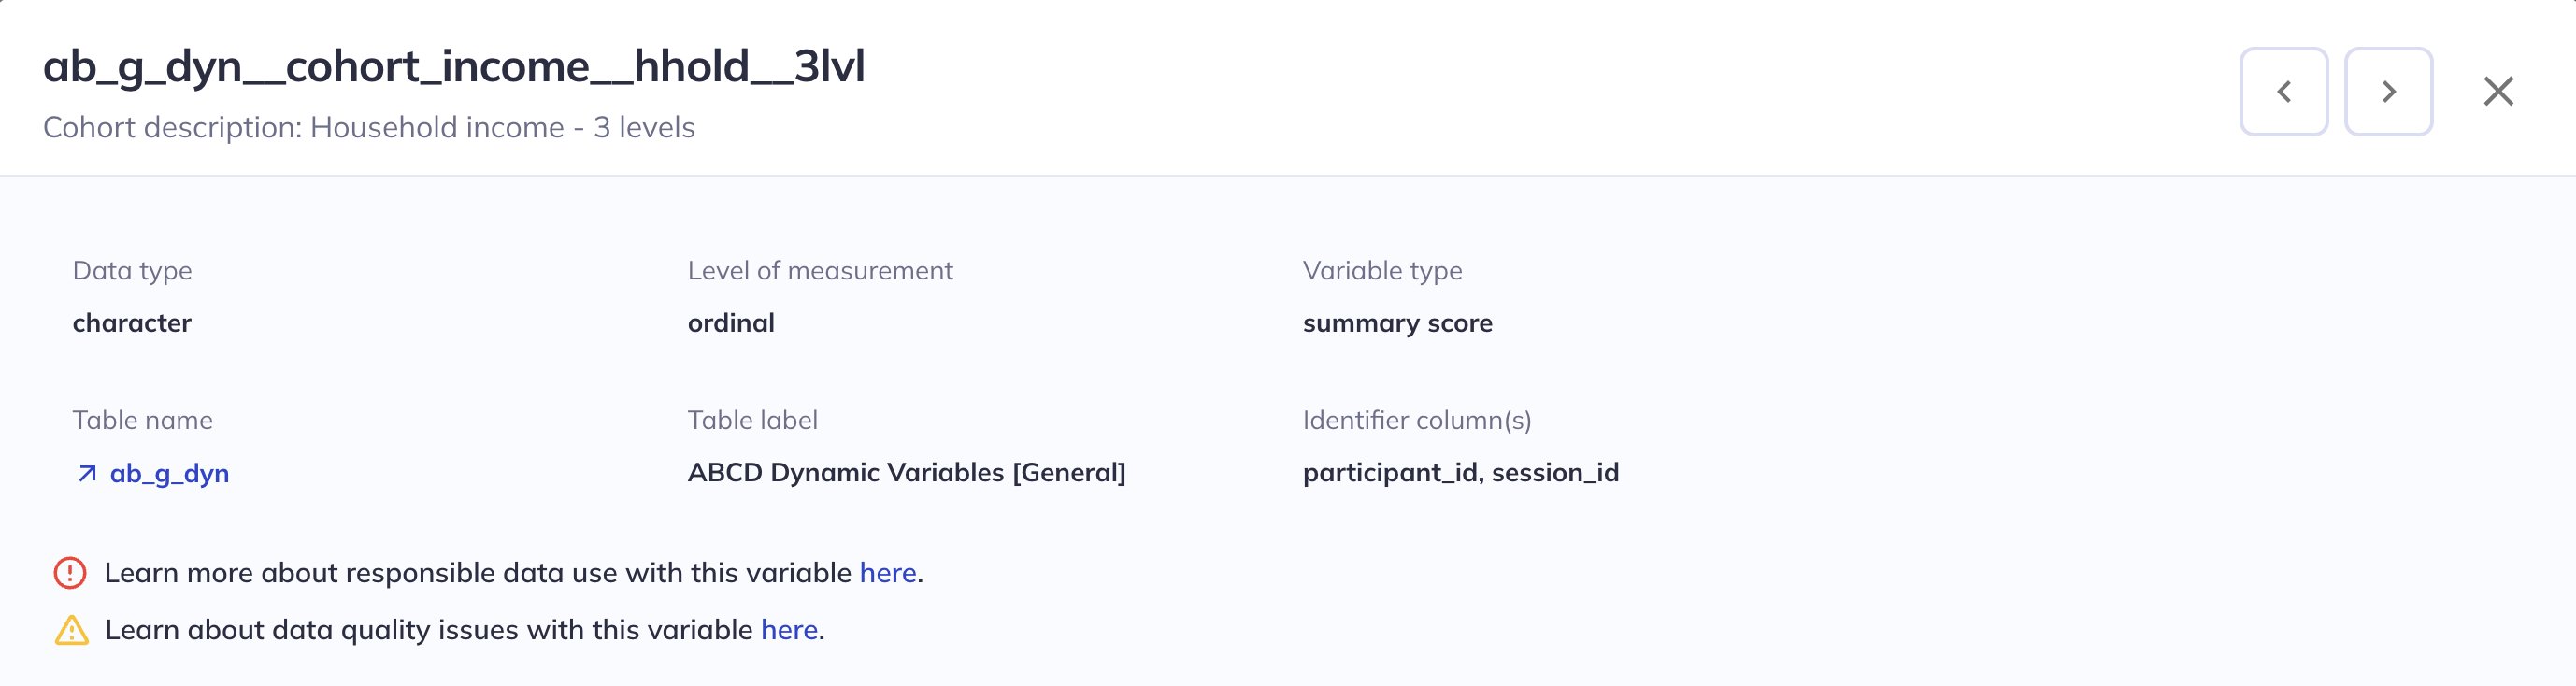
A header containing variable descriptors, warnings, & links to outside documentation
Brain atlas visualizer
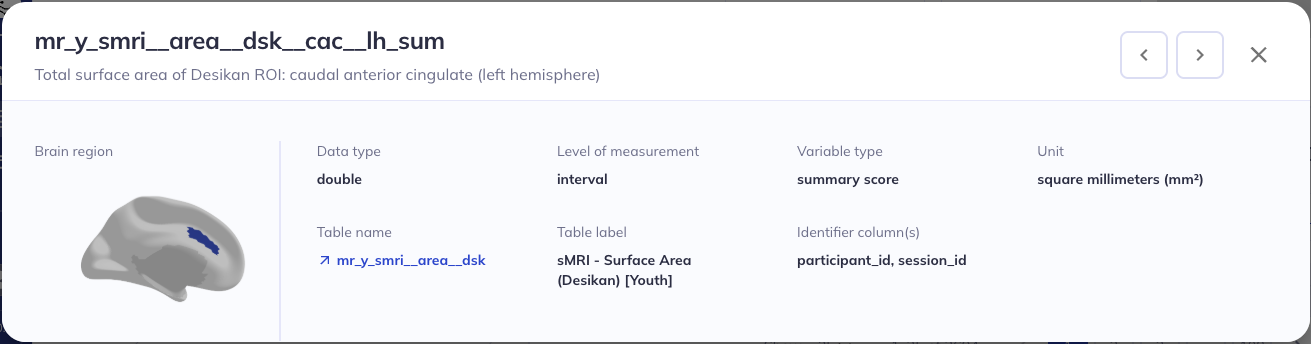
Example header for an imaging variable containing a brain atlas
Variables in the tabulated imaging data from specific brain atlases have an image depicting the region displayed on the left hand side of the variable details header. To see a larger version of the brain region, you can click on the image to open a 3D viewer; here you can rotate & enlarge the image.
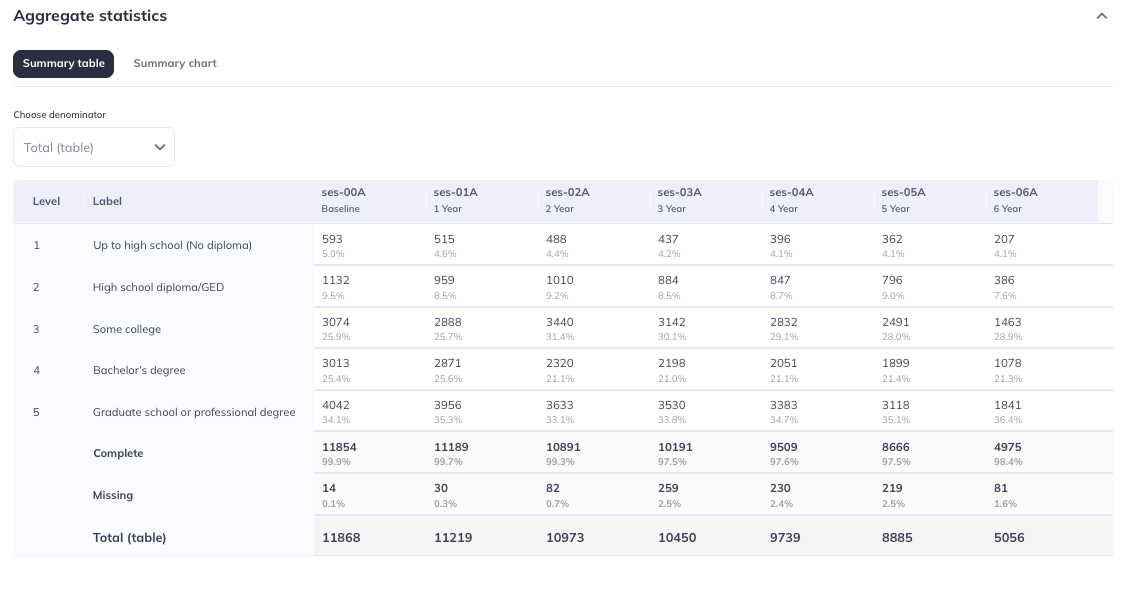
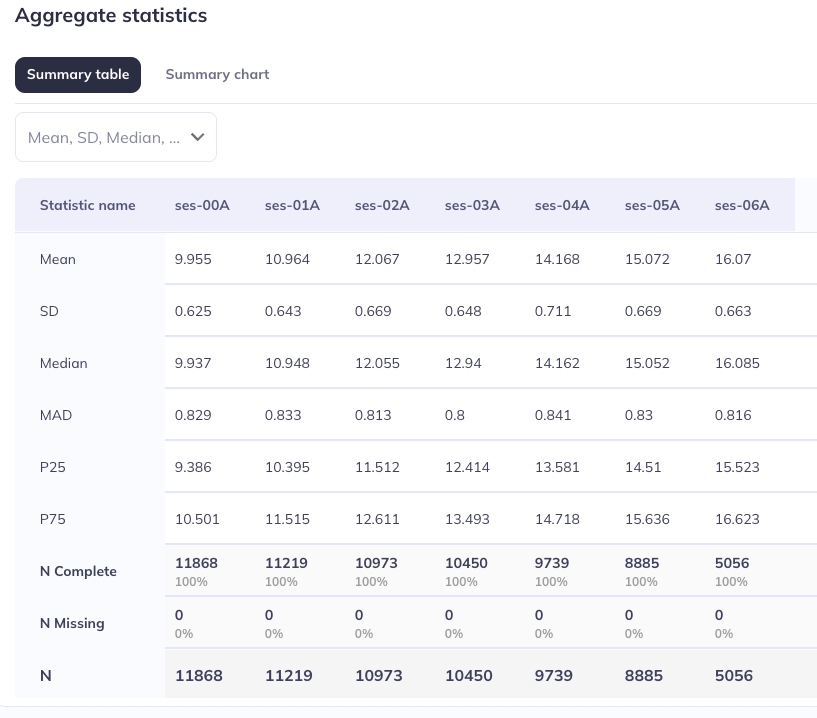
Aggregate statistics
The Aggregate statistics section displays basic descriptive statistics for the selected variable as a table and chart. The Data type dictates what type of descriptive statistics are displayed:
- For categorical variables (
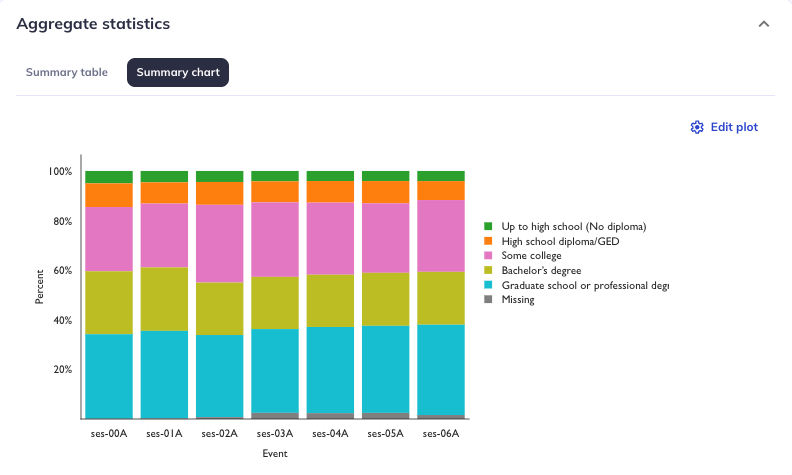
Data type: character), the table lists the frequencies of endorsements for the different response options / levels of the categorical variable as well as overall completeness and missingness counts by event; it also serves as a lookup table for which value in the data refers to which label/meaning. The summary chart displays these data as stacked bar graphs. - For continuous variables (
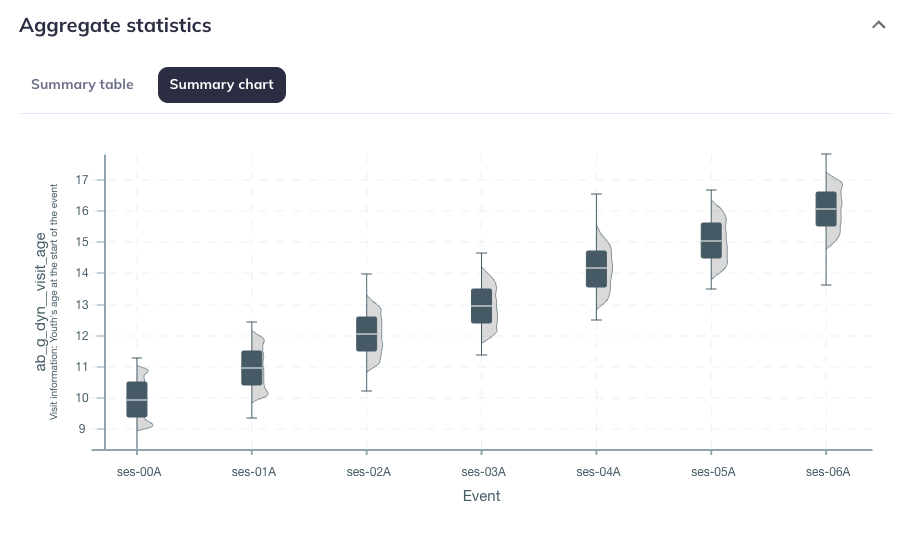
Data type: integer, double, date, timestamp, etc.), the table lists several basic summary statistics like minimums, maximums, quartiles, etc. as well as overall completeness and missingness counts by event. The summary chart displays the distributions by event using a combination of box plots and density plots. .
Categorical Data type
Continuous Data type
Event naming
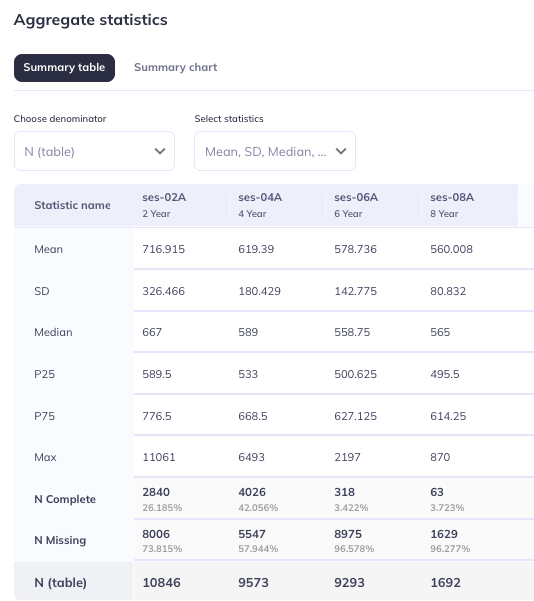
The aggregate statistics visualizations only contain the events for which that variable has data at. The visualizations display values only for events where there is data.
For example, the variable to the right only has data for events 2, 4, 6, and 8; so, only those years are displayed in the aggregate statistics table (and chart).
Variables may vary when they are administered independent of the table they belong to. The best way to identify what events data is present at is through the aggregate statistics visualizations or downloading the data.
Event names are provided in the summary table as the name (ses-##) and the label (`#Year). Summary charts display the event name.
Display customization
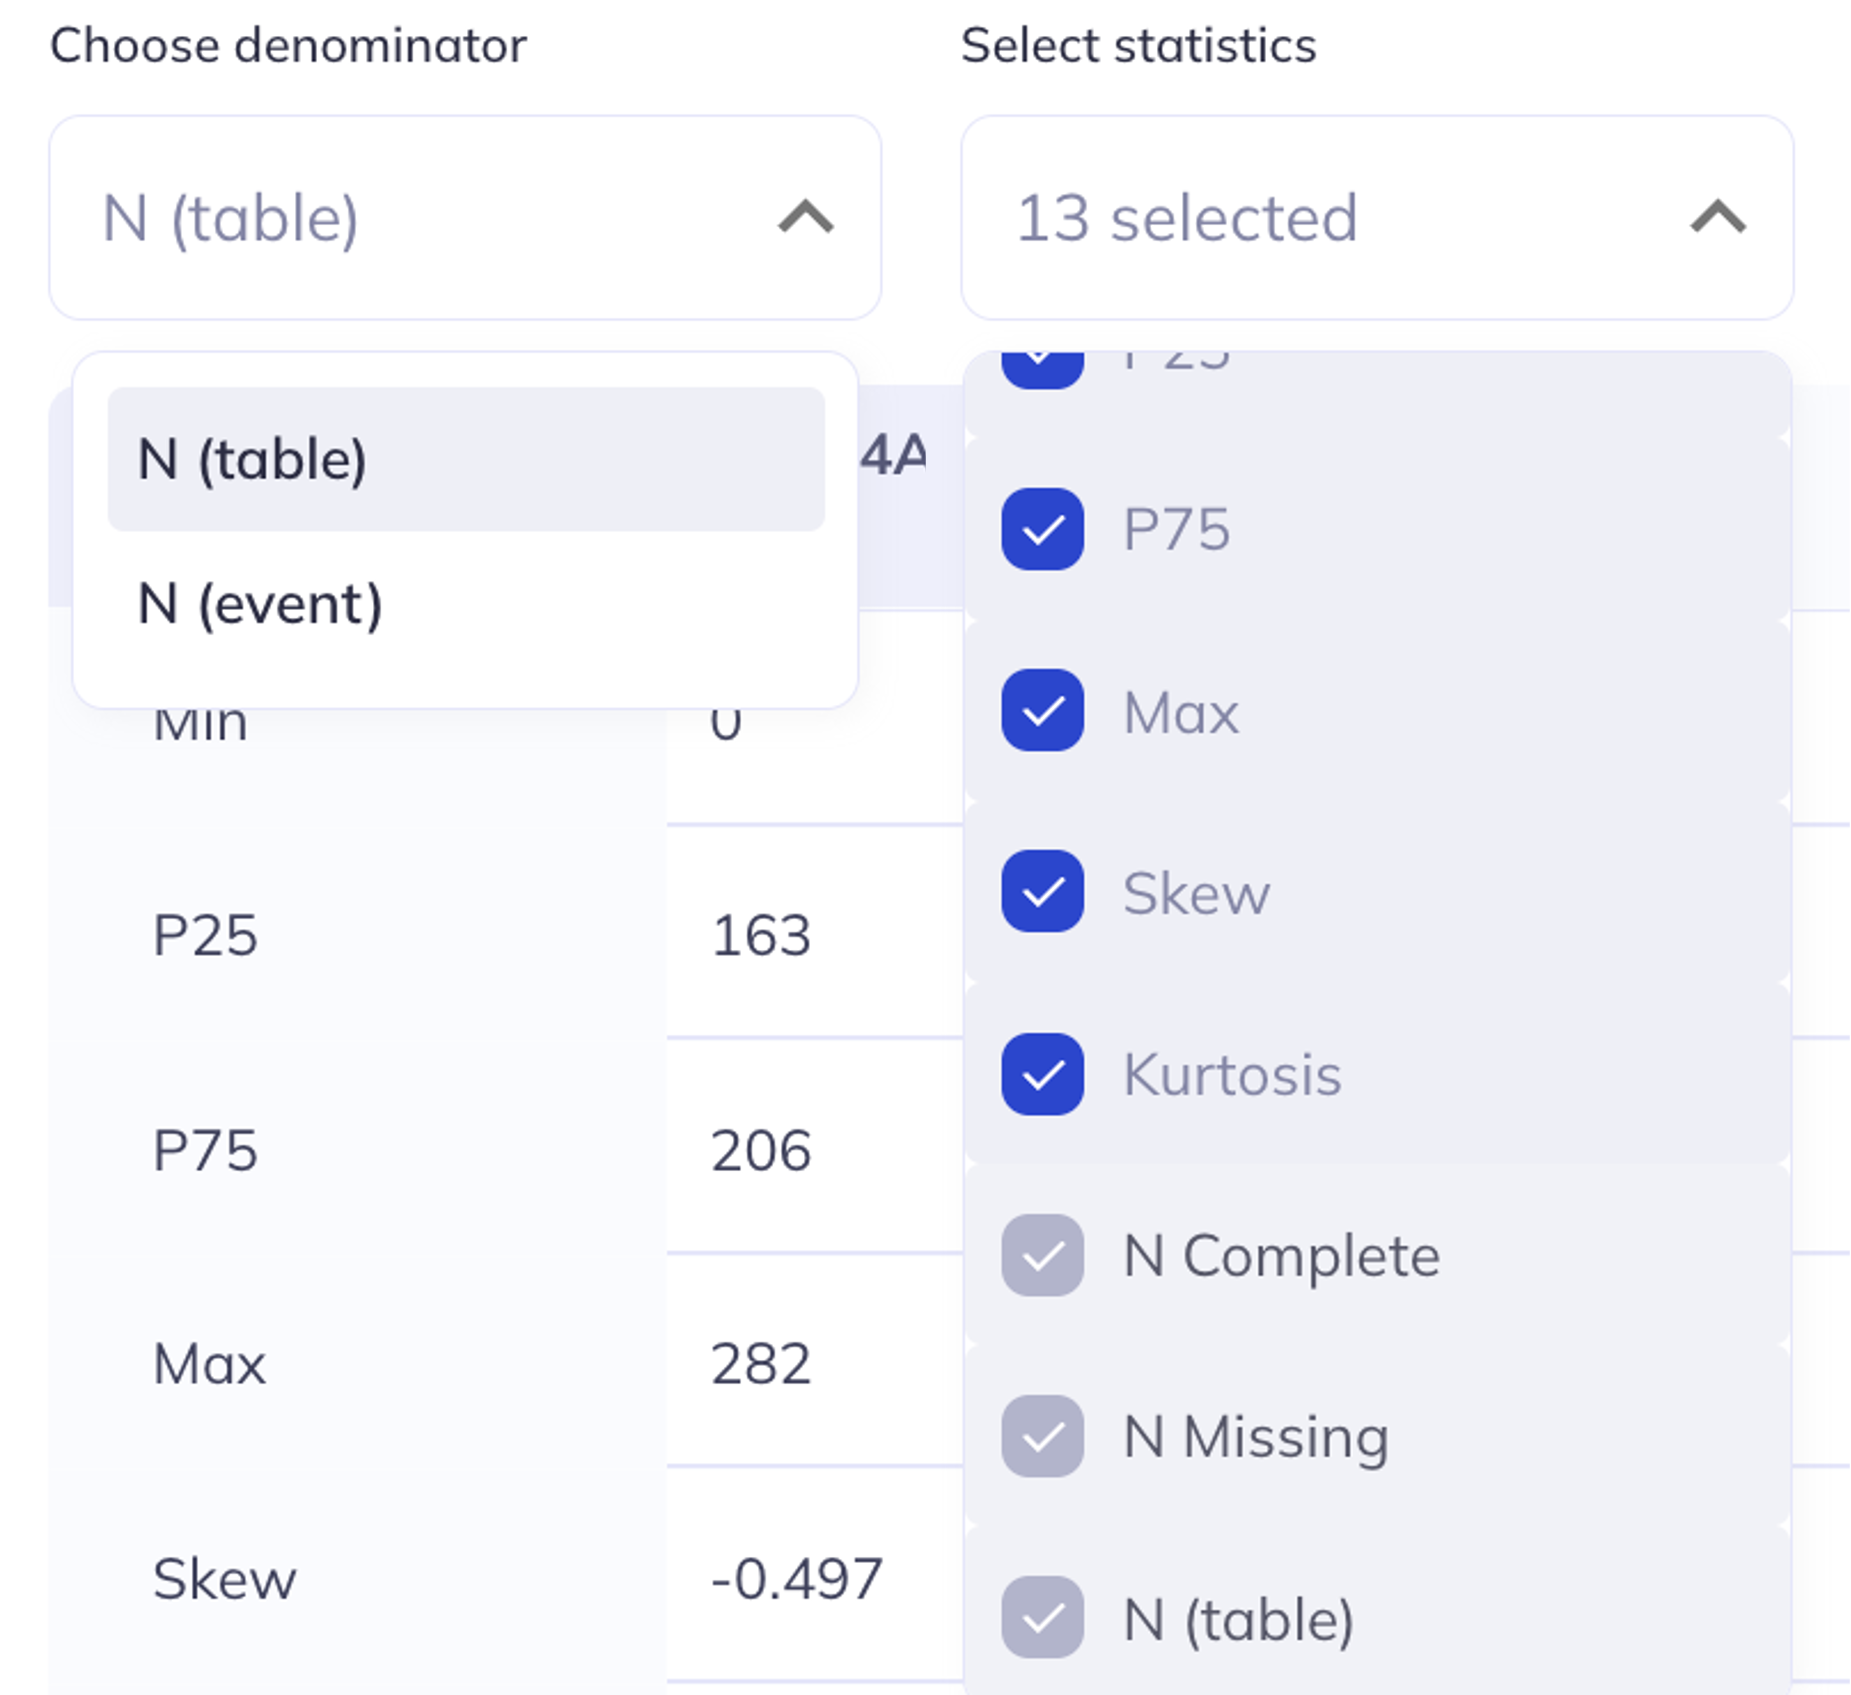
Select statistics: For tables of continuous variables, you can select/deselect which statistical values should be displayed.
Mean
Standard deviation (SD)
Median
Mean absolute deviation (MAD)
25th percentile (P25)
75th percentile (P75)
Skew
Kurtosis
Choose denominator: In the summary table you can choose whether you would like the denominator to be represented as table or event. Choosing table will include any participant who has a value for any variable within that table. If you select event all participants who have any data for that event will be included in the total count. Selections in this tab will also effect the summary chart.
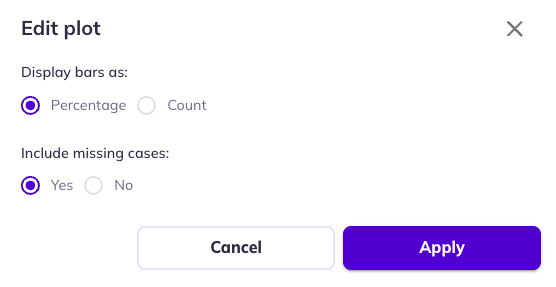
Edit plot: Stacked bar charts (categorical variables) allow you to toggle between percentages and counts as well as to filter out participants who are missing a value for that variable (but are included in the table/event count).
Administrative information
The Administrative information section provides further context about how a given variable was administered, especially for surveys/questionnaires. It includes the headers and instructions that are being displayed to the participants while they’re filling out the survey as well as other details about the variable like the field type (radio, date-time, checkbox, etc), the order of appearance in the form, and the branching logic (also called skip logic) applied to the variable. Some variables may have images if the image was part of the administrative instructions for the participant.
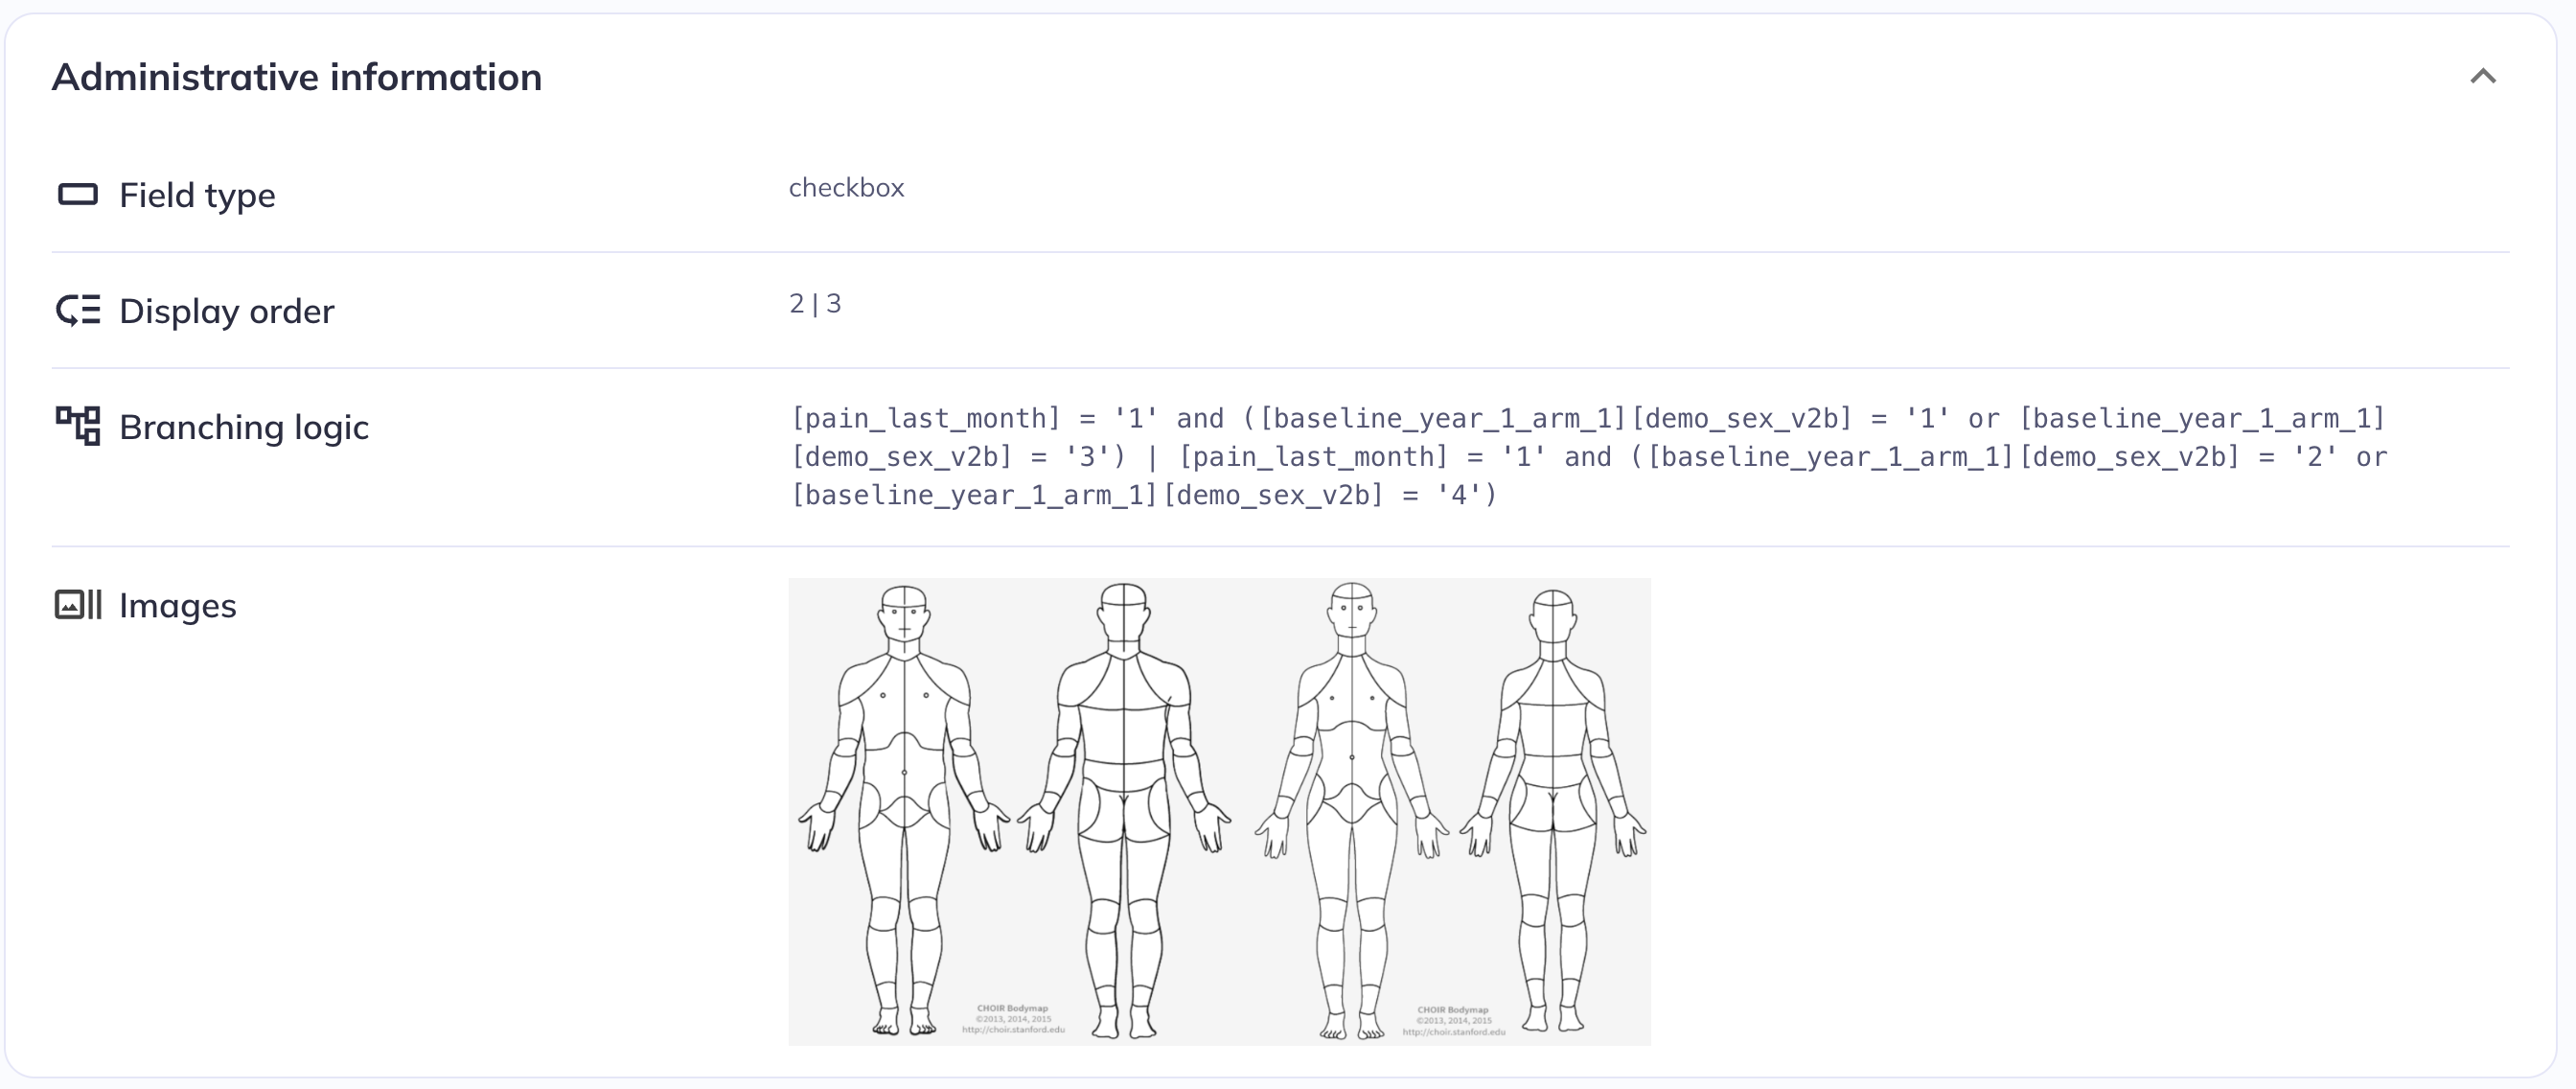
Administrative information for ph_y_pq__abdomen__frntl_001 (ABCD study)
The branching logic is currently provided based on the variable names and syntax used in the study’s electronic data capture system, REDCap (the name mapping section below describes how to look up the REDCap name of a given variable). Future versions of DEAP and the data dictionary viewer will translate the branching logic into the release variable names.
Ontology location
The Ontology section provides the ontology tree nodes that the variable is nested under. This information can be helpful for understanding where variables exist in the ontology tree or sending instructions to others on how to access specific variables.
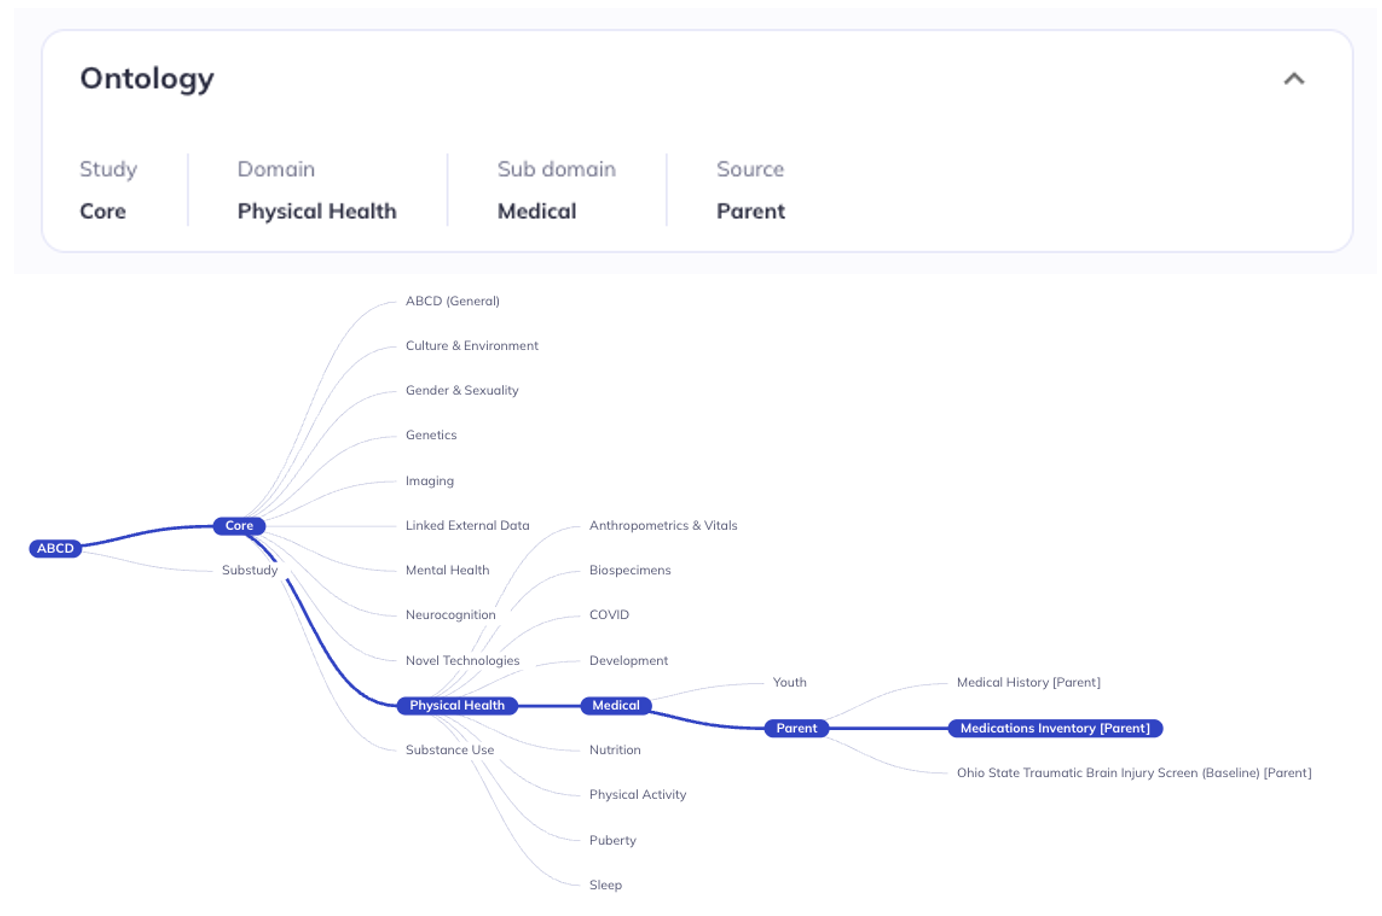
The description in the detail view matches the ontology tree structure
Study data features
Data warnings
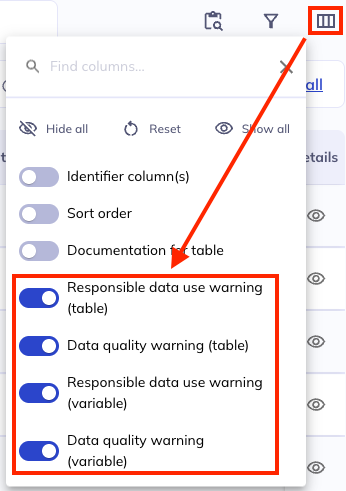
Data warnings have special indicators in the data dictionary table. These warnings exist as columns in the data dictionary and are viewable in the data dictionary table & the variable details.
There are two kinds of warnings in the ABCD & HBCD datasets; responsible data use & data quality. Warnings may be applied to individual variables or whole tables. Learn more about these warnings in the study documentation:
The presence of a warning is displayed next to the Table name and/or Variable name as an icon.
Responsible data use warning
Data quality warning
Hover over the alert icon and there will be a link on the word details that will take you to the variable details tab; from there you can navigate to the warnings information on each studies respective websites.
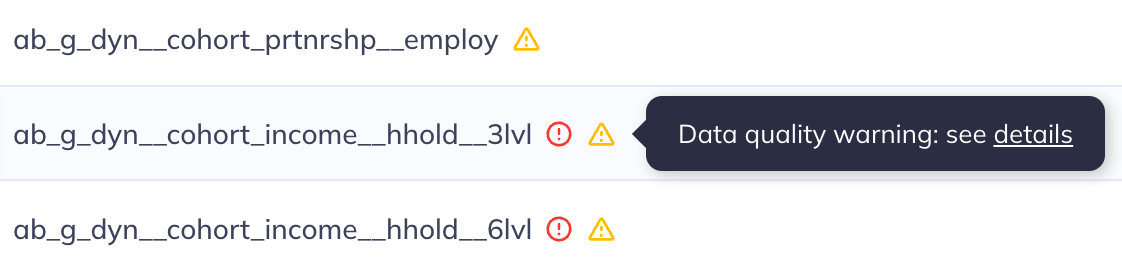
Example warnings in the data dictionary table
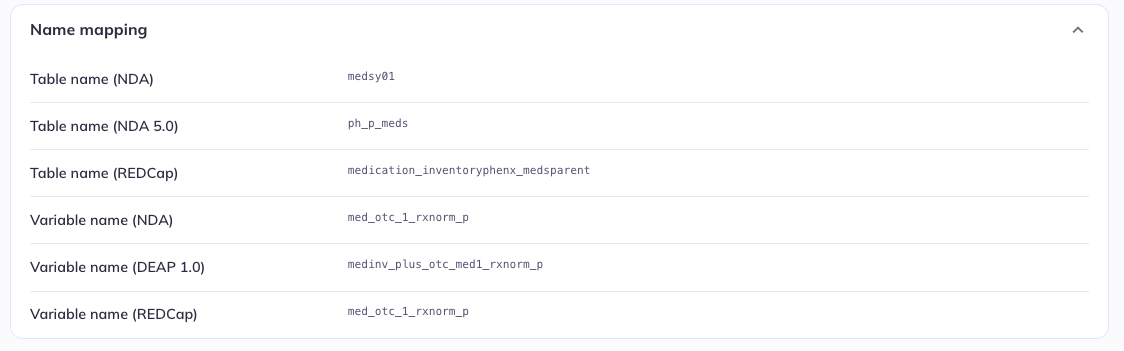
Name mapping
HBCD does not have name mapping. ABCD has name mapping to REDCap variable names & past release conventions.
The Name mapping section provides information about the name(s) a given variable has or what table(s) it is part of in other contexts, e.g., in past releases. The possible options are:
Table name (NDA): The table the variable was part of before the 5.0 releaseTable name (NDA): The table the variable was part of in the 5.0/5.1 releaseTable name (REDCap): The table/form the variable is part of in the electronic data capture system used for the study, REDCapVariable name (NDA): The name of the variable that in previous releasesVariable name (DEAP 1.0): The name of thevariable in the classic version of DEAPVariable name (REDCap): The name of the variable in the electronic data capture system used for the study, REDCap
Only the elements that are relevant for a given variable are displayed (e.g., if the variable is released for the first time in the 6.0 release, the names for previous releases will be missing, etc.). This information is provided to allow users to relate the tabulated data from the new curation implemented for the 6.0 release to previous versions.
As a reminder the branching logic in administrative information uses the REDCap names, visible in this section.