• Home
  • Datasets
    • Data dictionary explorer
    • Create a custom dataset
    • My datasets
  • Explorations
    • Create an exploration
    • Visualizations
  • Analyses
    • FEMA Overview
    • Model specification
    • Results visualization
    • Splines
  • Manage
    • My objects
    • Projects & labels
  • Info
    • Ticketing & feedback
    • FAQs
    • Additional resources
    • Platform updates
  1. Visualization types
  • Create an exploration
  • Visualization types

On this page

  • Bar, Dot, & Lollipop charts
  • Scatter chart
  • Histogram
  • Summary table
  • Count table
  • Crosstabulation table
  • Correlation table

Visualization types

Bar, Dot, & Lollipop charts

NoteStacked bar chart: Grouped by variable; Stratified by session (row)
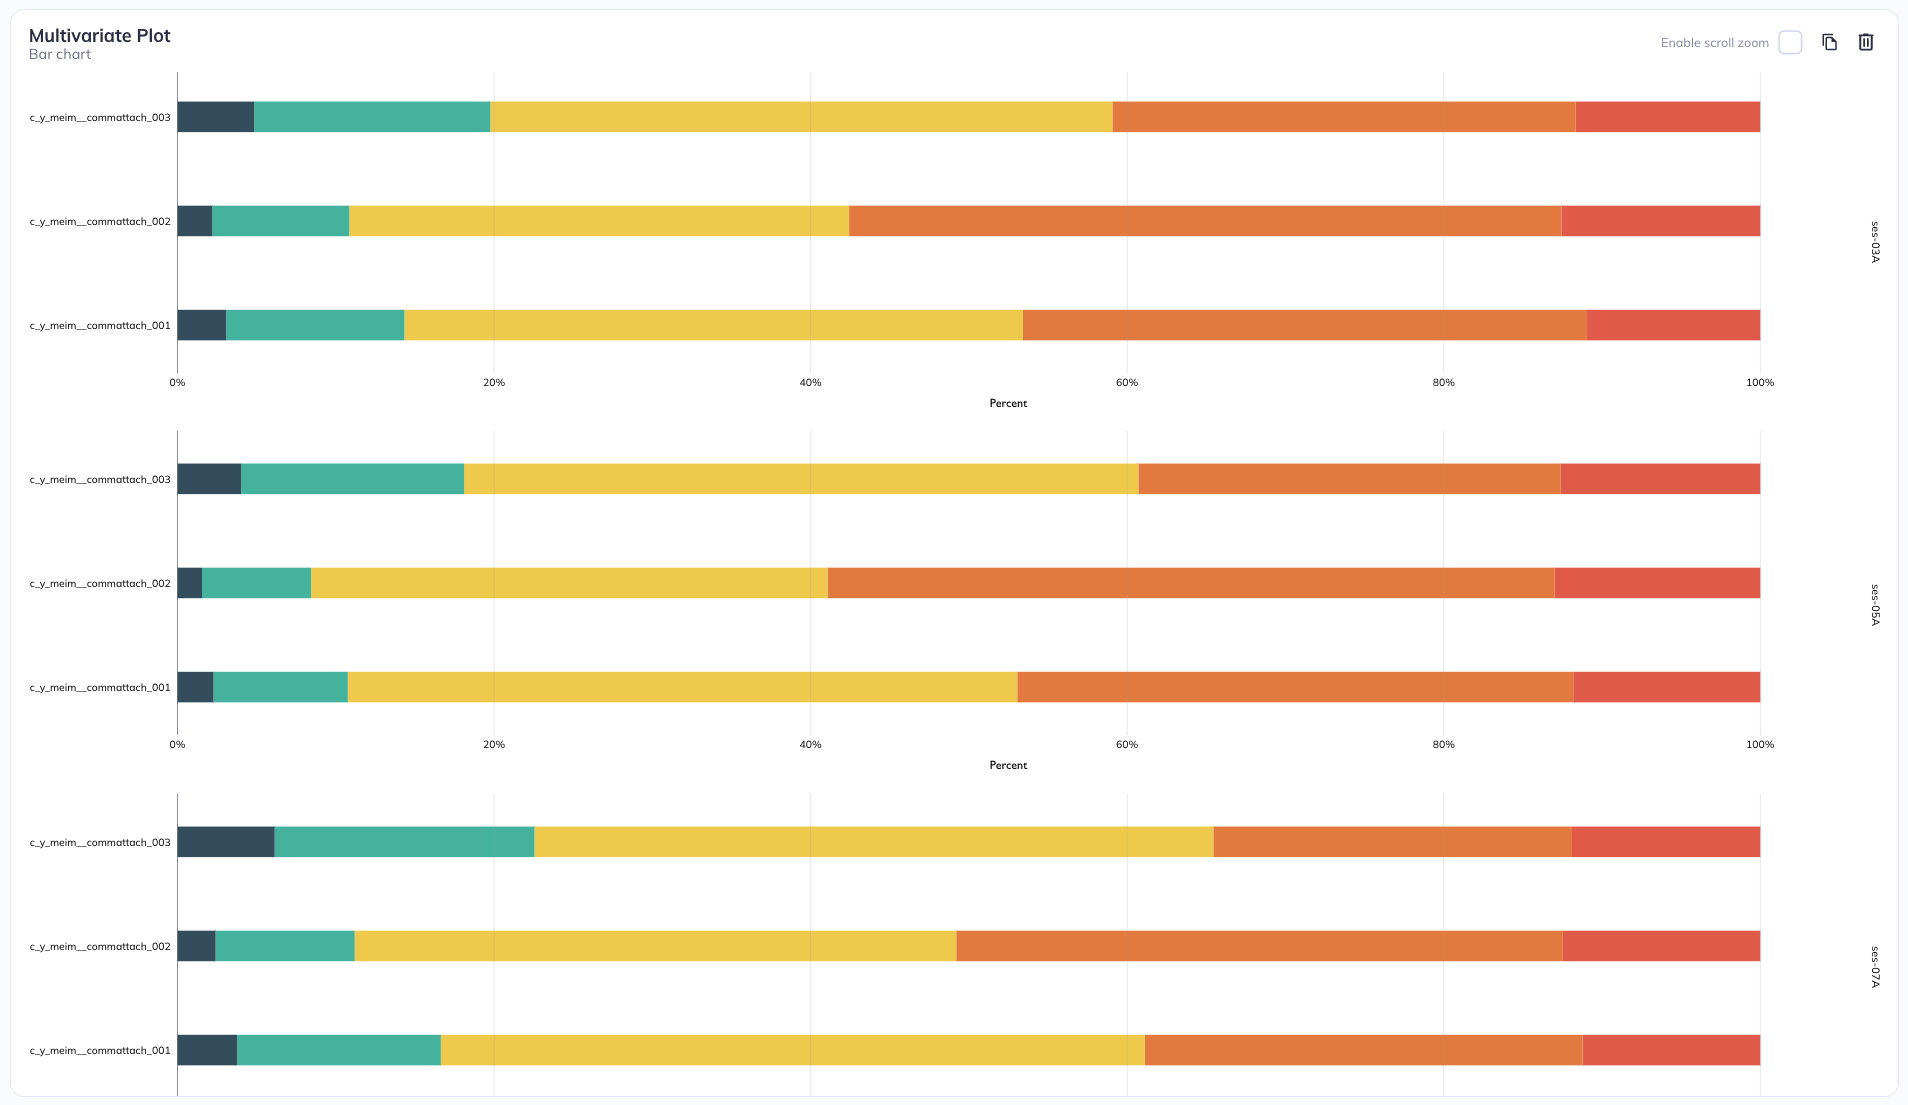
  • Variables
  • Settings/Notes
Variable(s) c_y_meim_commatach_001 c_y_meim_commatach_002 c_y_meim_commatach_003
Grouping Focus variables
Coloring Categorical levels
Stratification (row) session_id
Bar type Stacked
Flip axes True
Synchronize True
Show as Percent
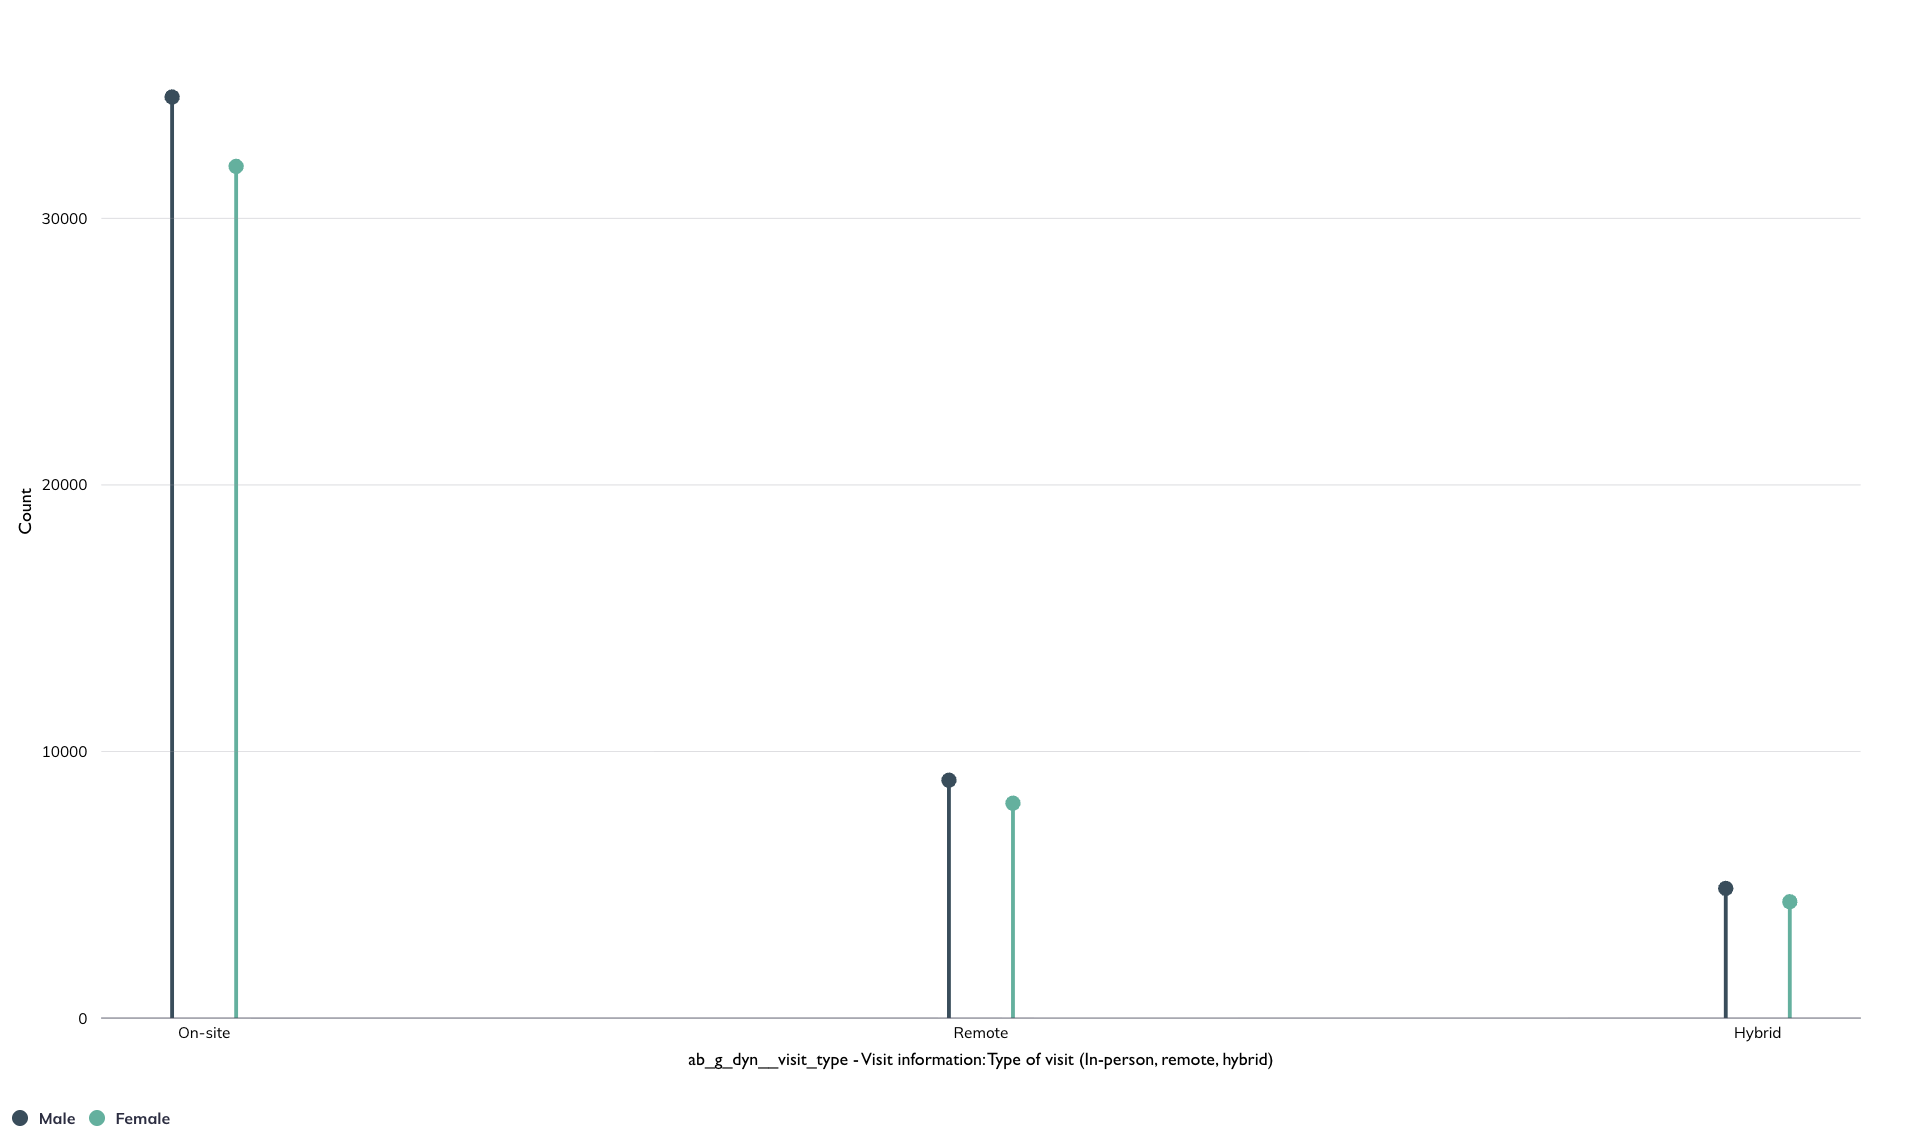
NoteLollipop chart: Colored by sex

  • Variables
  • Settings/Notes
Variable(s) ab_g_dyn__visit_type
Grouping Categorical levels
Coloring By variable: ab_g_stc__cohort_sex
Stratification N/A
Flip axes False
Synchronize axes N/A
Show as Count
NoteDot plot: Colored by visit type; Stratified by sex (column)
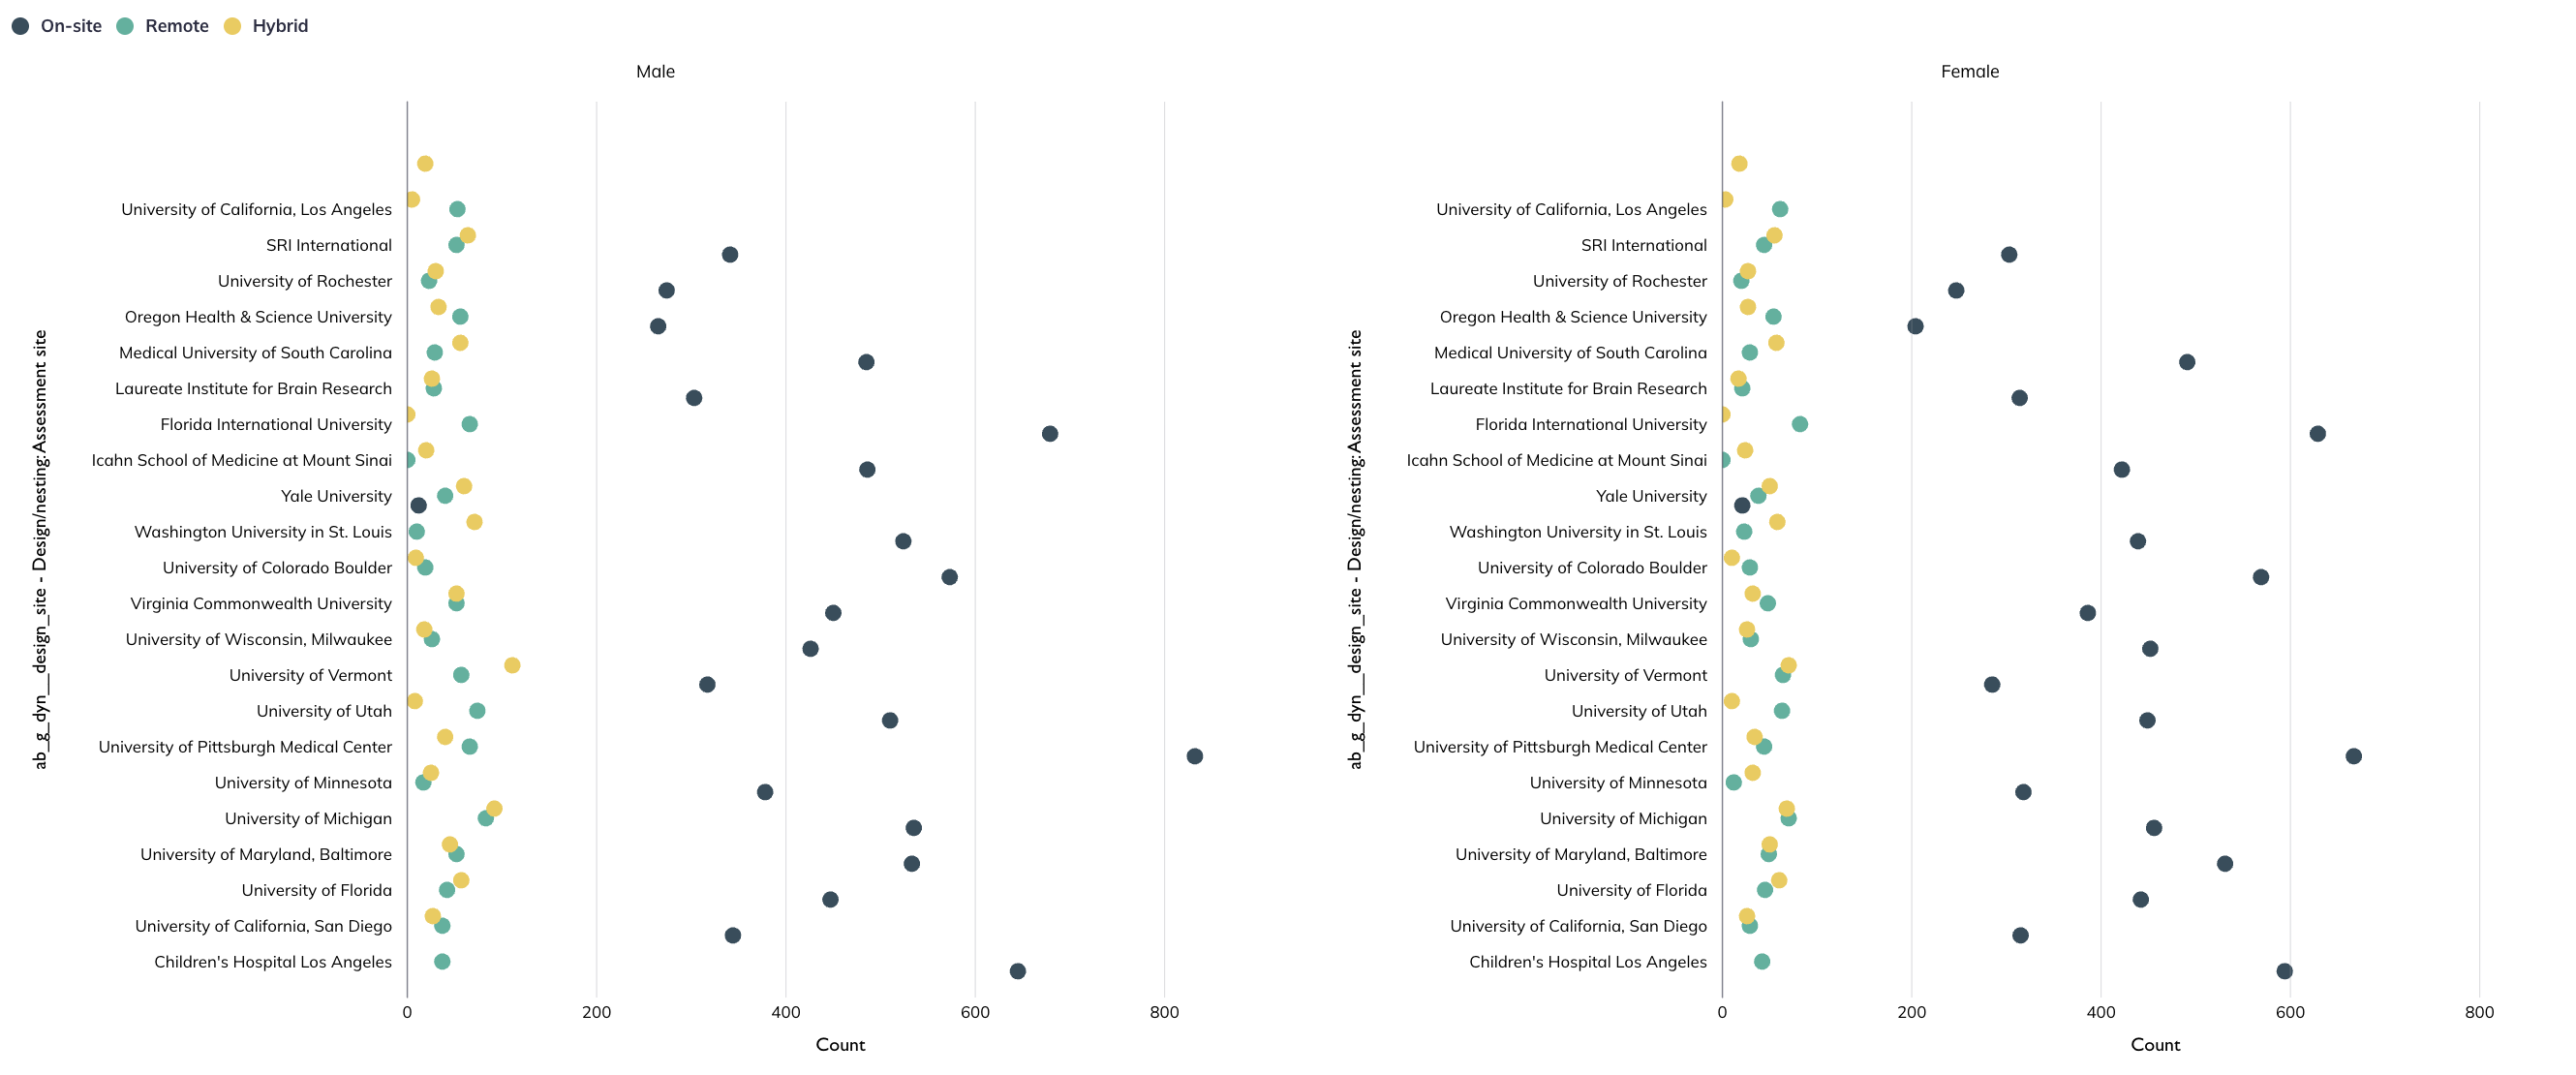
  • Variables
  • Settings/Notes
Variable(s) ab_g_dyn__design_site
Grouping Categorical levels
Coloring By variable: ab_g_dyn__visit_type
Stratification (column) By variable: ab_g_stc__cohort_sex
Flip axes True
Synchronize axes True
Show as Count
Notes Text settings are modified to allow large Y-axis labels. Labels are right adjusted and then have ‘200’ padding.

Scatter chart

NoteScatter chart: Weight & cholesterol; Colored by sex
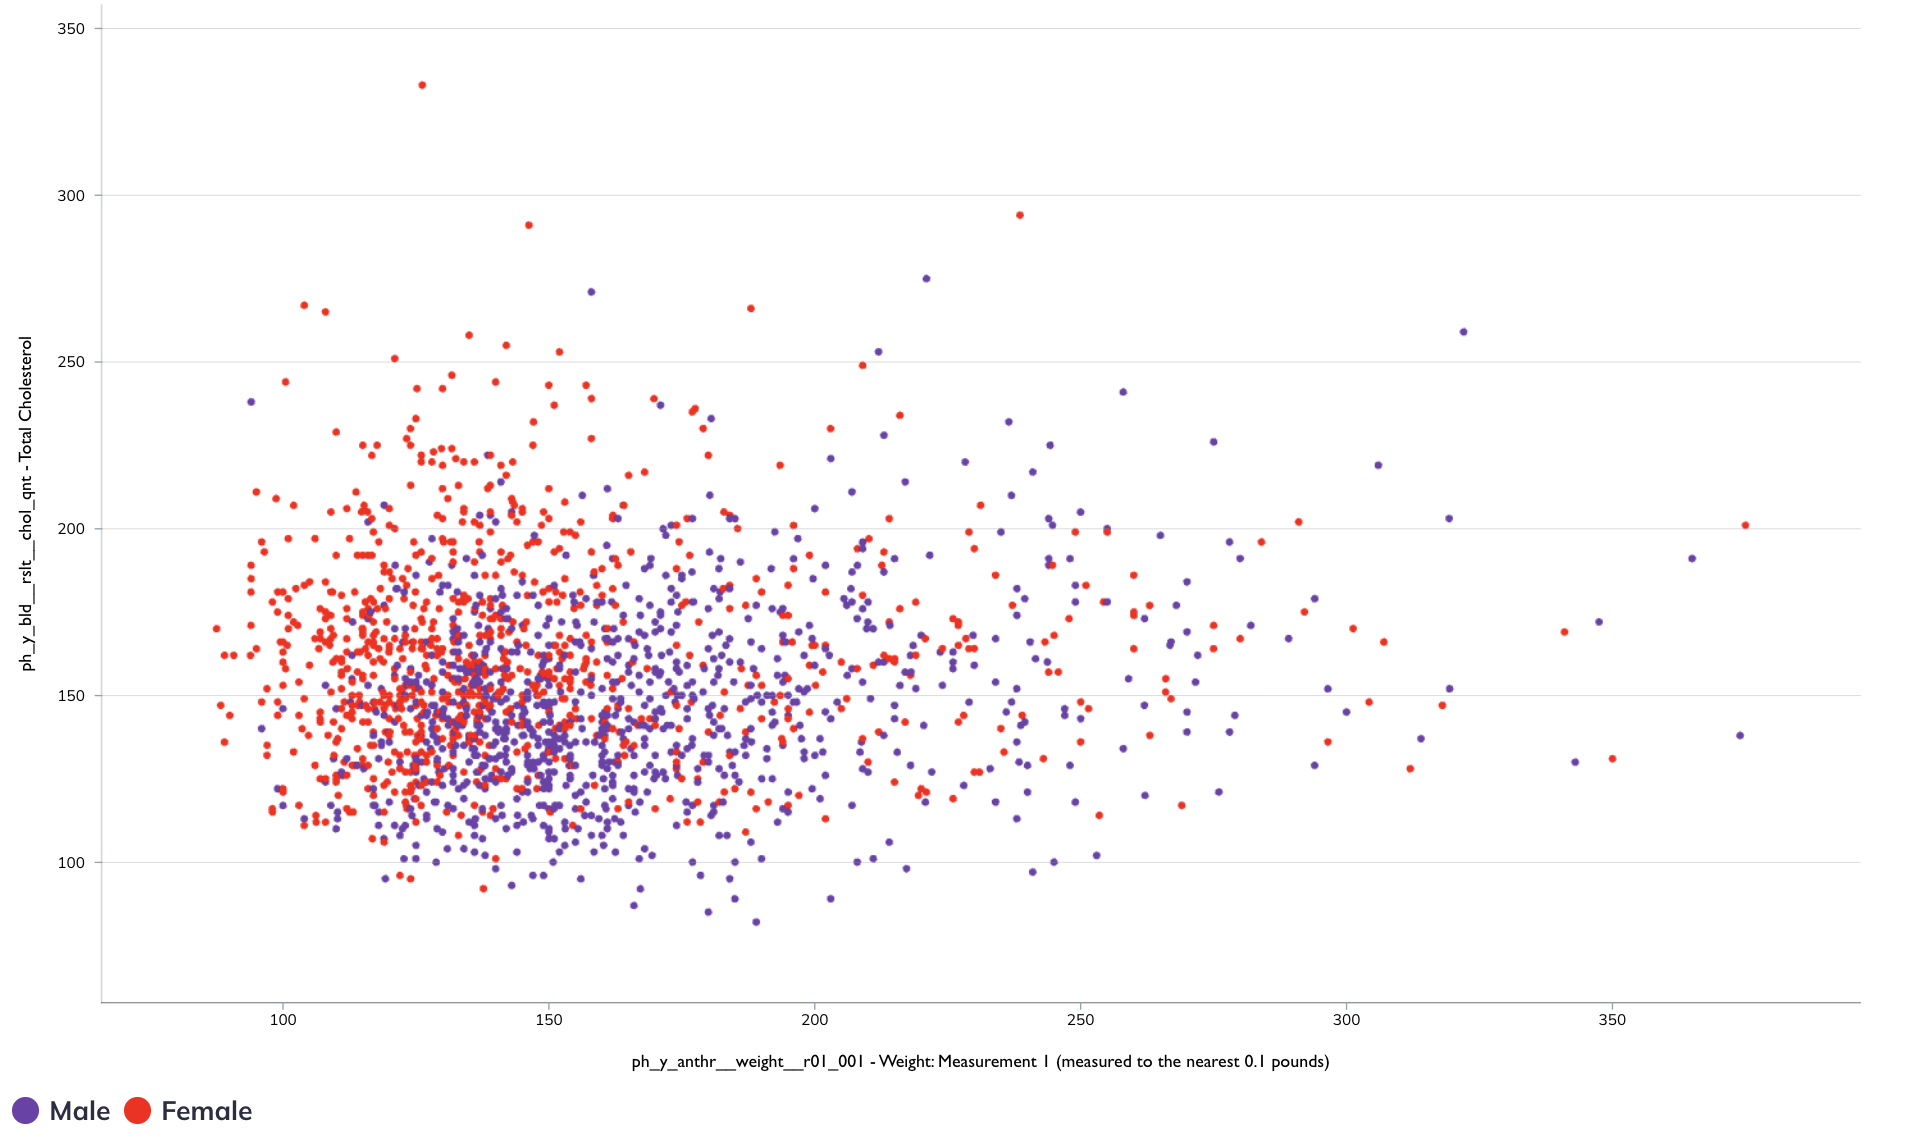
  • Variables
  • Settings/Notes
Variable(s) X axis: ph_y_anthr__weight__r01_001
Y axis: ph_y_bld__rslt__chol_qnt
Color By variable: ab_g_stc__cohort_sex
Stratification N/A
Flip axes False
Synchronize axes N/A
Notes All data are displayed in the plot (set below the Y Axis) but the plot is filtered to only show two sessions of data. The size of the key has also been adjusted in text settings.

Histogram

NoteHistogram: Participant height; Colored by sex; Stratified by session
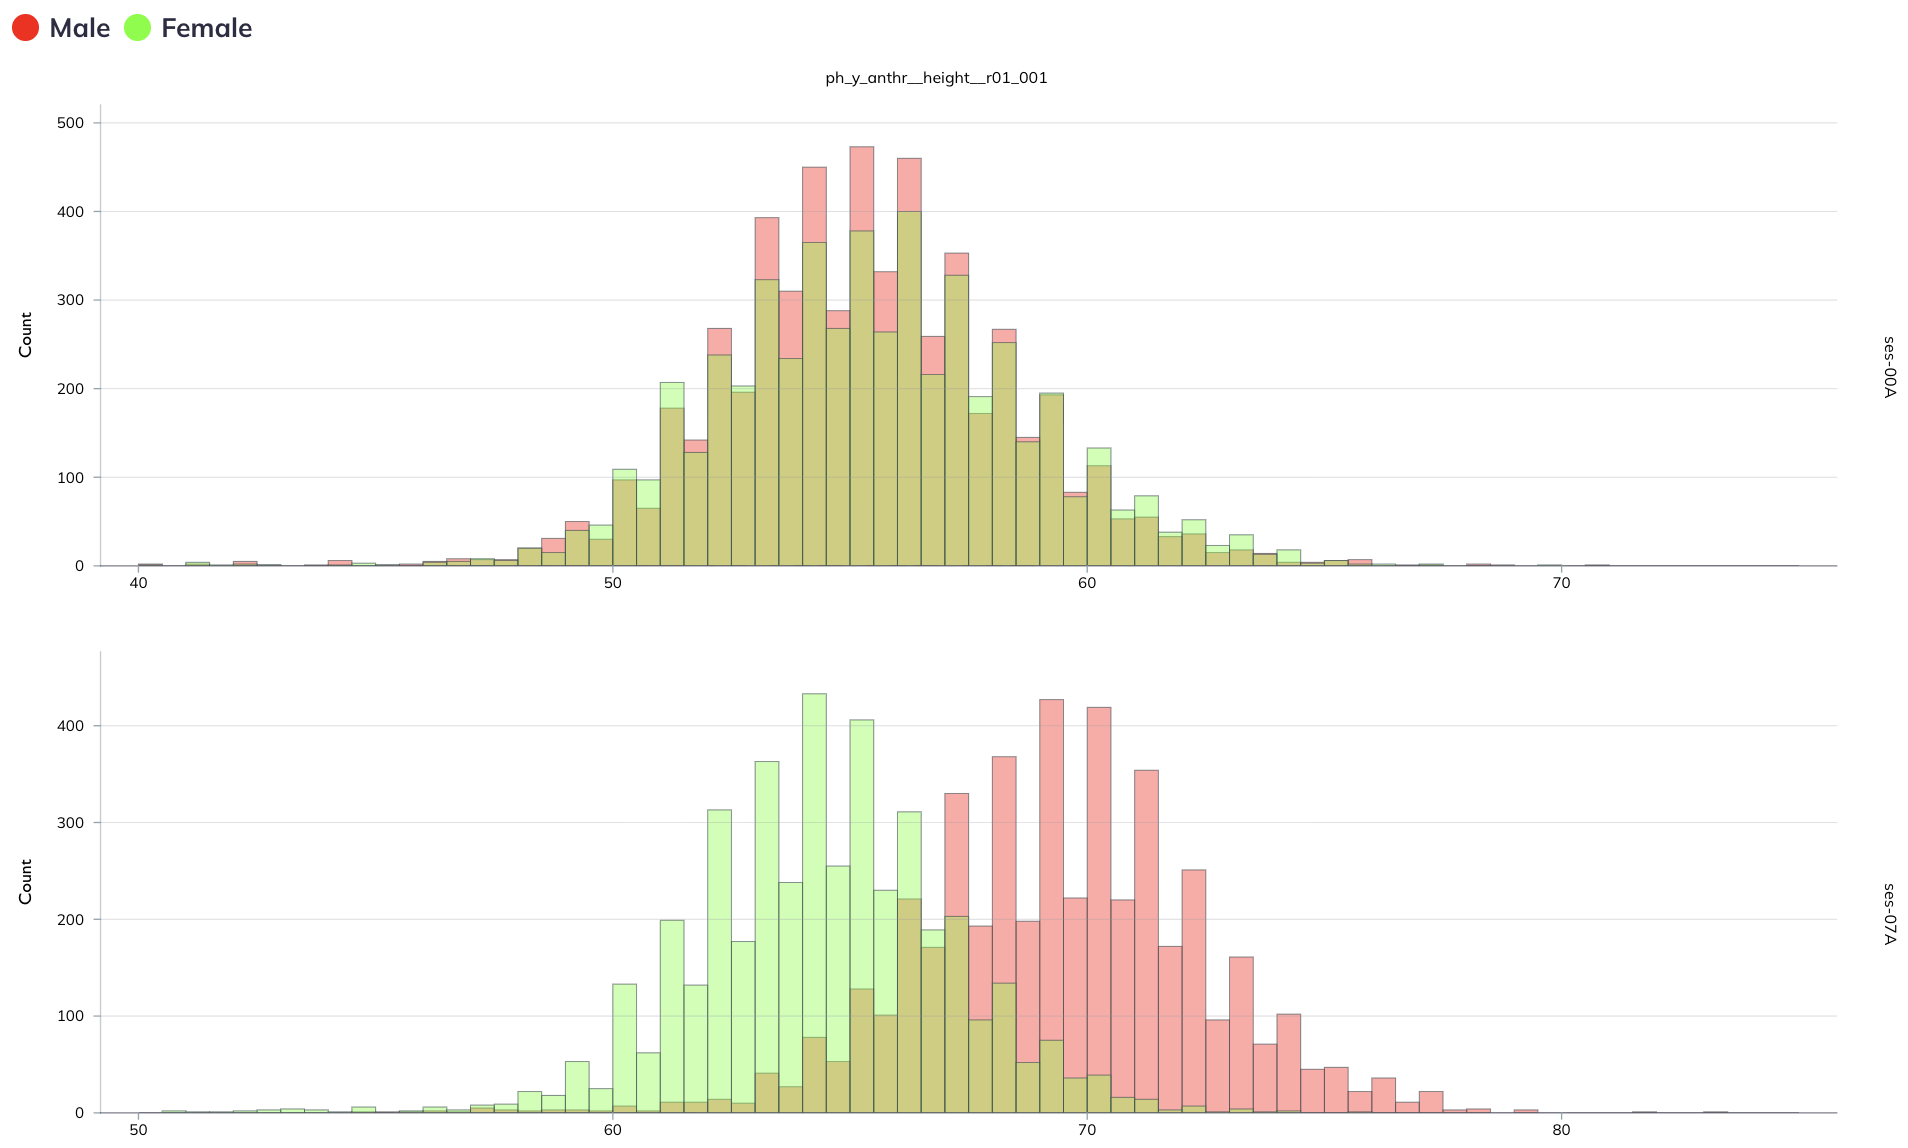
  • Variables
  • Settings/Notes
Variable(s) ph_y_anthr__height__r01_001
Color By variable: ab_g_stc__cohort_sex
Stratification (row) session_id
Chart type Histogram (No density)
Flip axes False
Synchronize False
Show as Count
Notes Chart is recolored manually (Colors tab) and key has been moved from default position and size increased (Text tab)

Summary table

NoteSummary table (Categorical): Survey variables by session
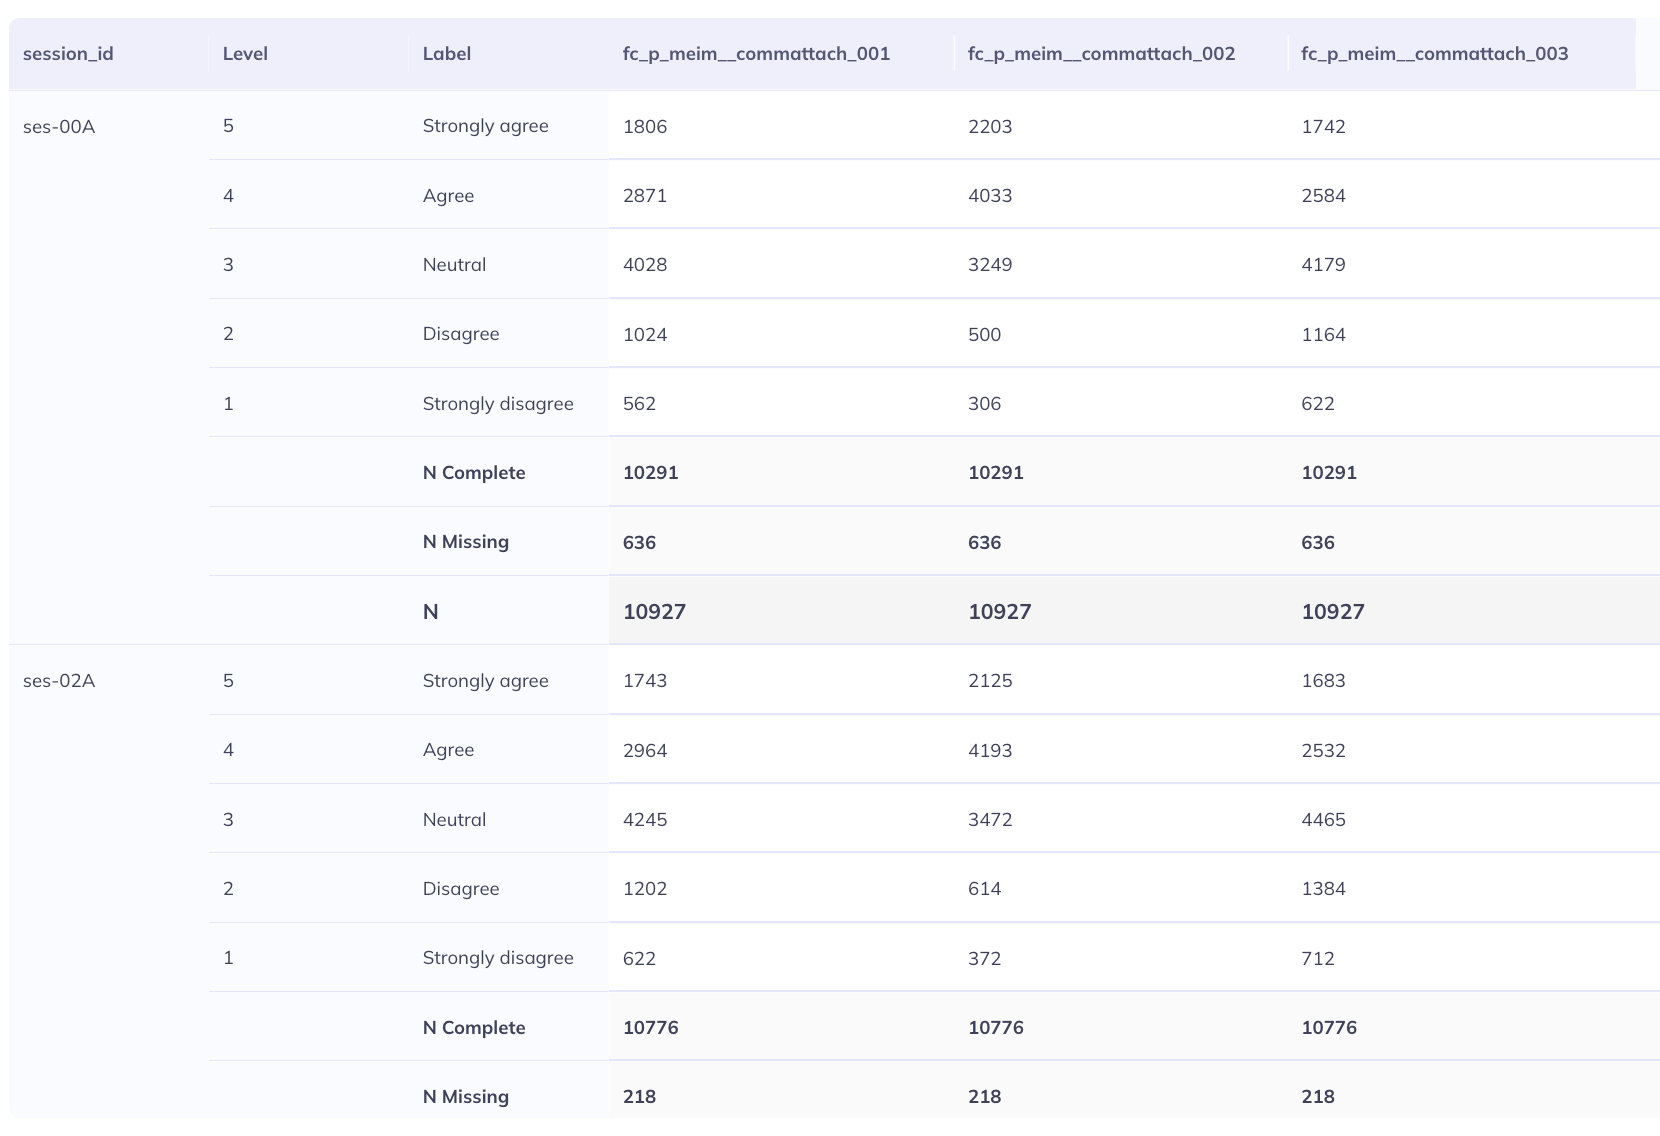
  • Variables
  • Settings/Notes
Variable(s) fc_p_meim__commattach_001
fc_p_meim__commattach_002
fc_p_meim__commattach_003
Stratification By variable: ab_g_stc__cohort_sex
Flip axes False
Displayed as columns Focus variables
Notes All three variables have same response options so responses collapse into the same rows.
NoteSummary table (Continuous): Height, weight, waist measurements by participant sex
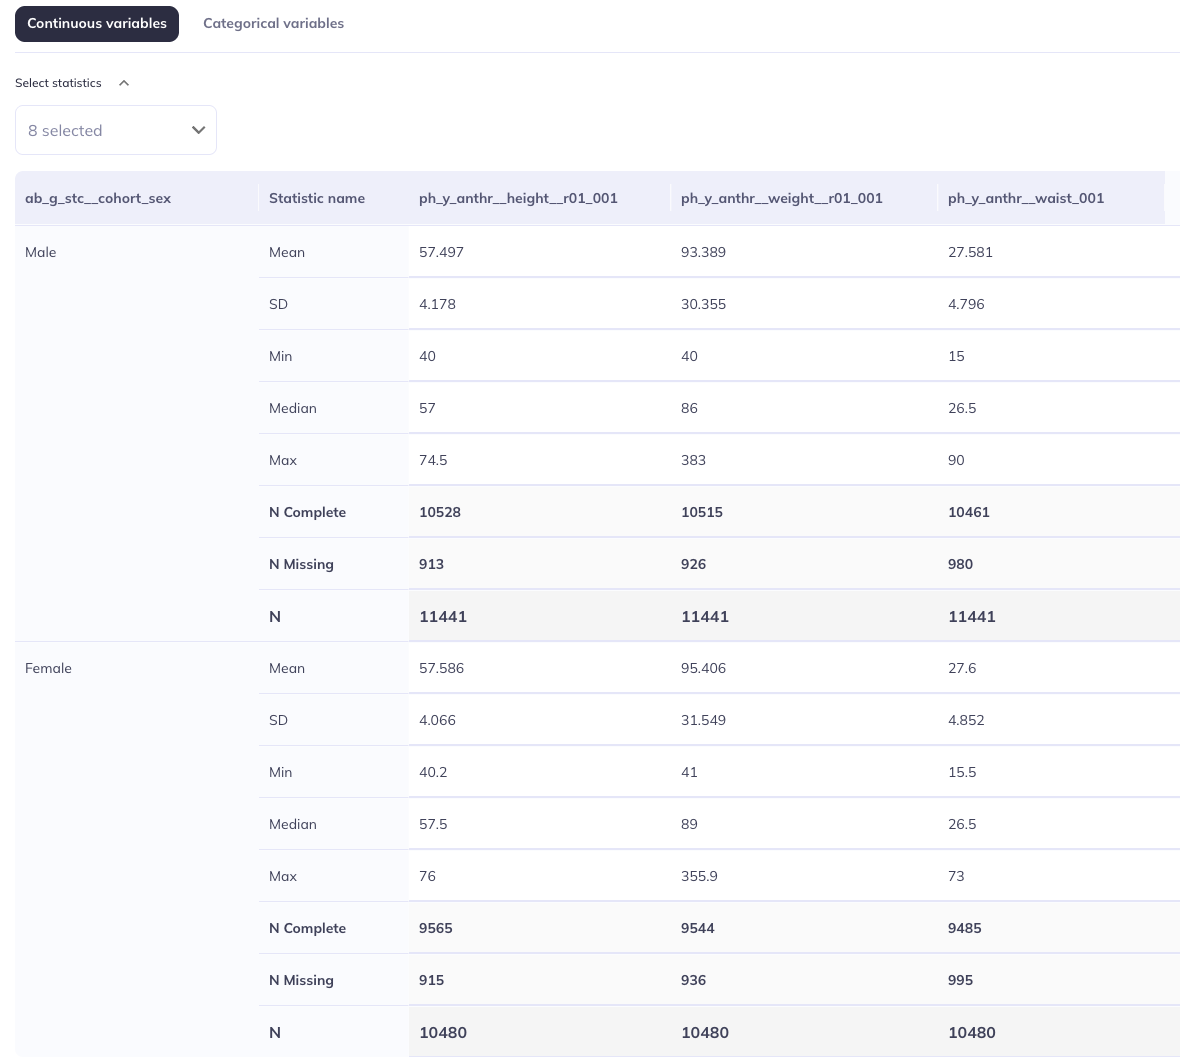
  • Variables
  • Settings/Notes
Variable(s) ph_y_anthr__weight__r01_001
ph_y_anthr__height__r01_001
ph_y_anthr__waist_001
Displayed as columns Focus variables
Flip axes False
Displayed as columns Focus variables

Count table

NoteCount table: Permutations of site, visit type, and session
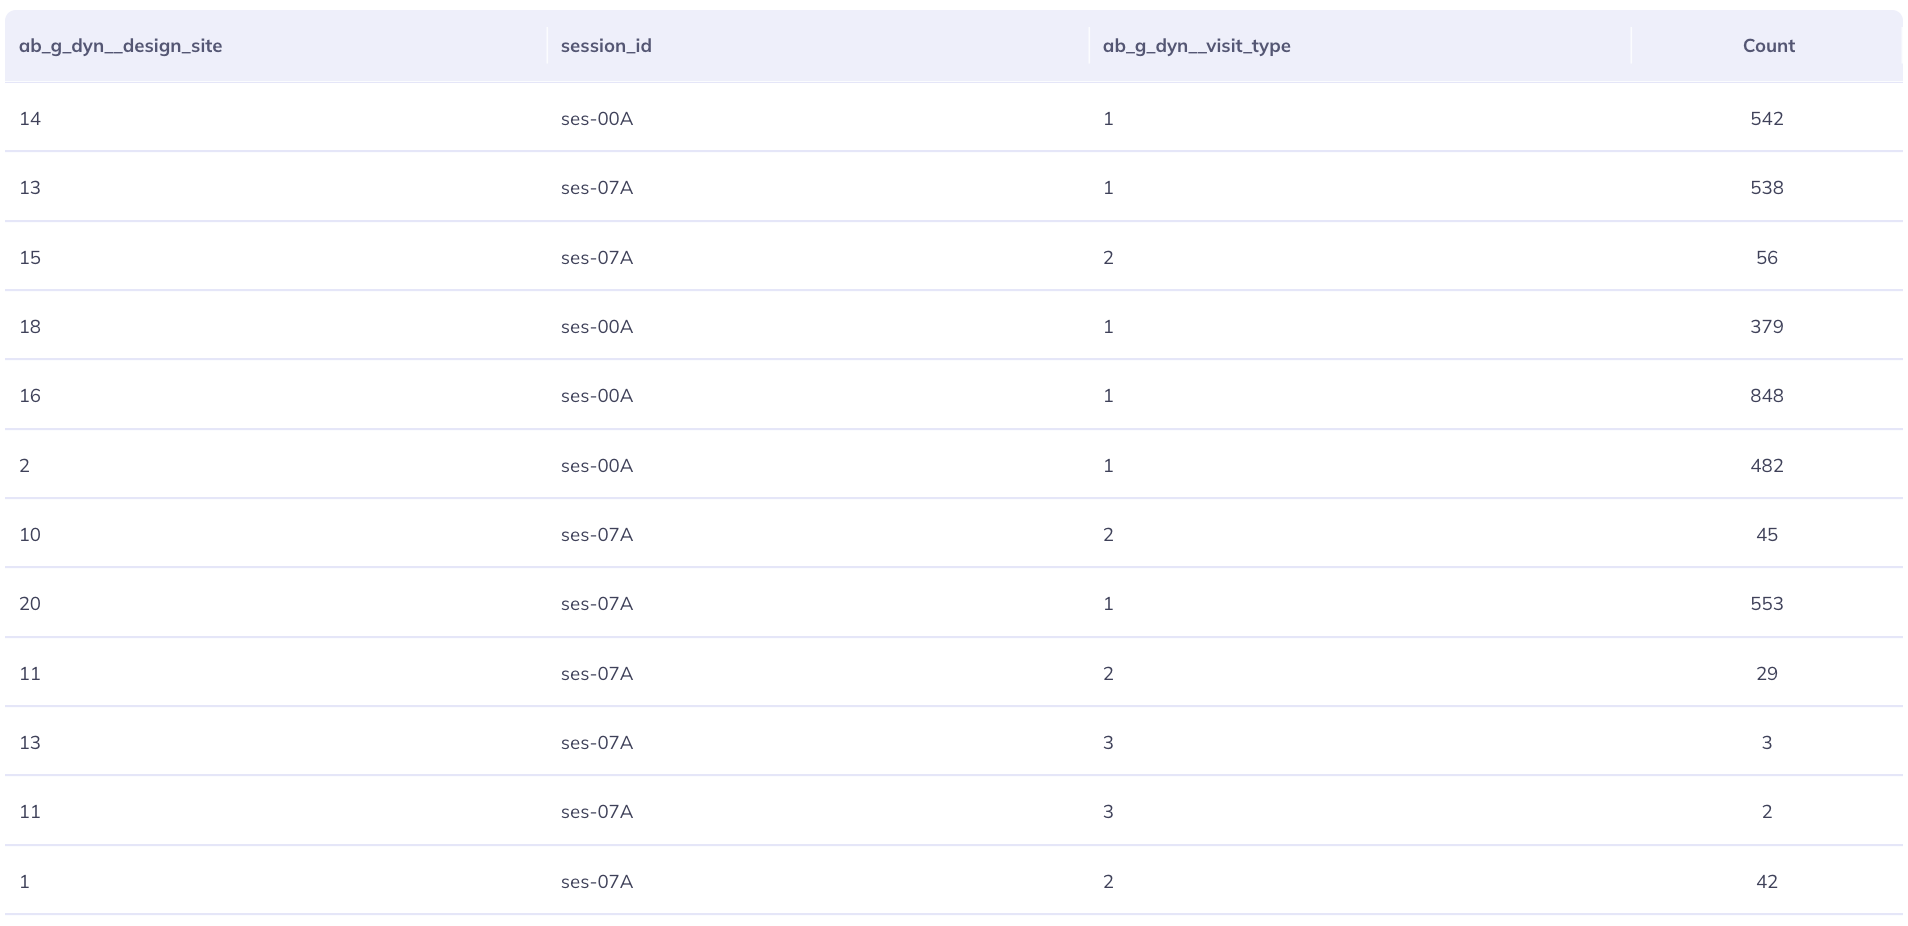
  • Variables
  • Settings/Notes
Variable(s) ab_g_dyn__design_site
session_id
ab_g_dyn__visit_type
Transformations None applied
Show level labels False

Crosstabulation table

NoteCross tab: Combinations of site, visit type, sex
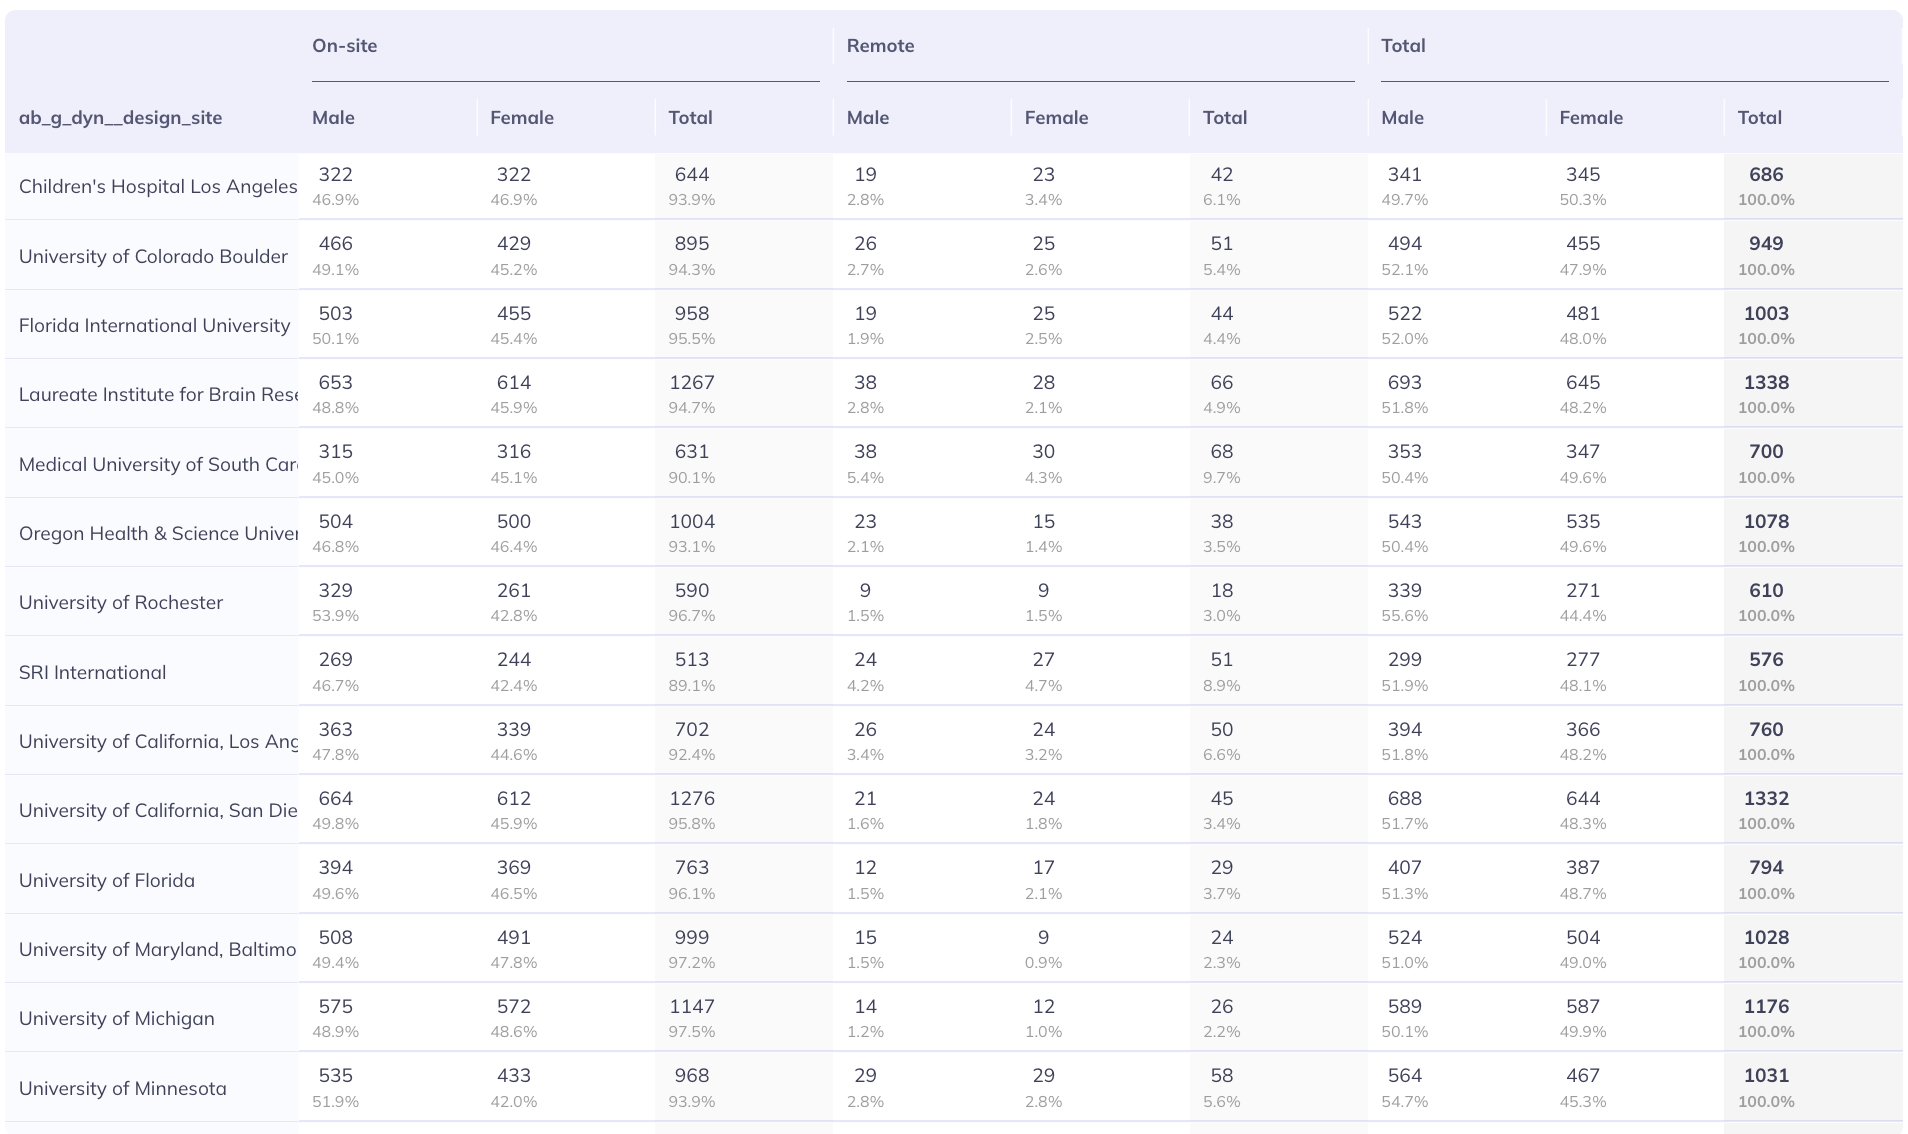
  • Variables
  • Settings/Notes
Variable(s) X1: ab_g_stc__cohort_sex
X2: ab_g_dyn__visit_type
Y1: ab_g_dyn__design_site
Focus variable None
Display as Count/Percentage
Calculate percentage by Row

Correlation table

NoteCorrelation table: Parent vs youth survey data within timepoint
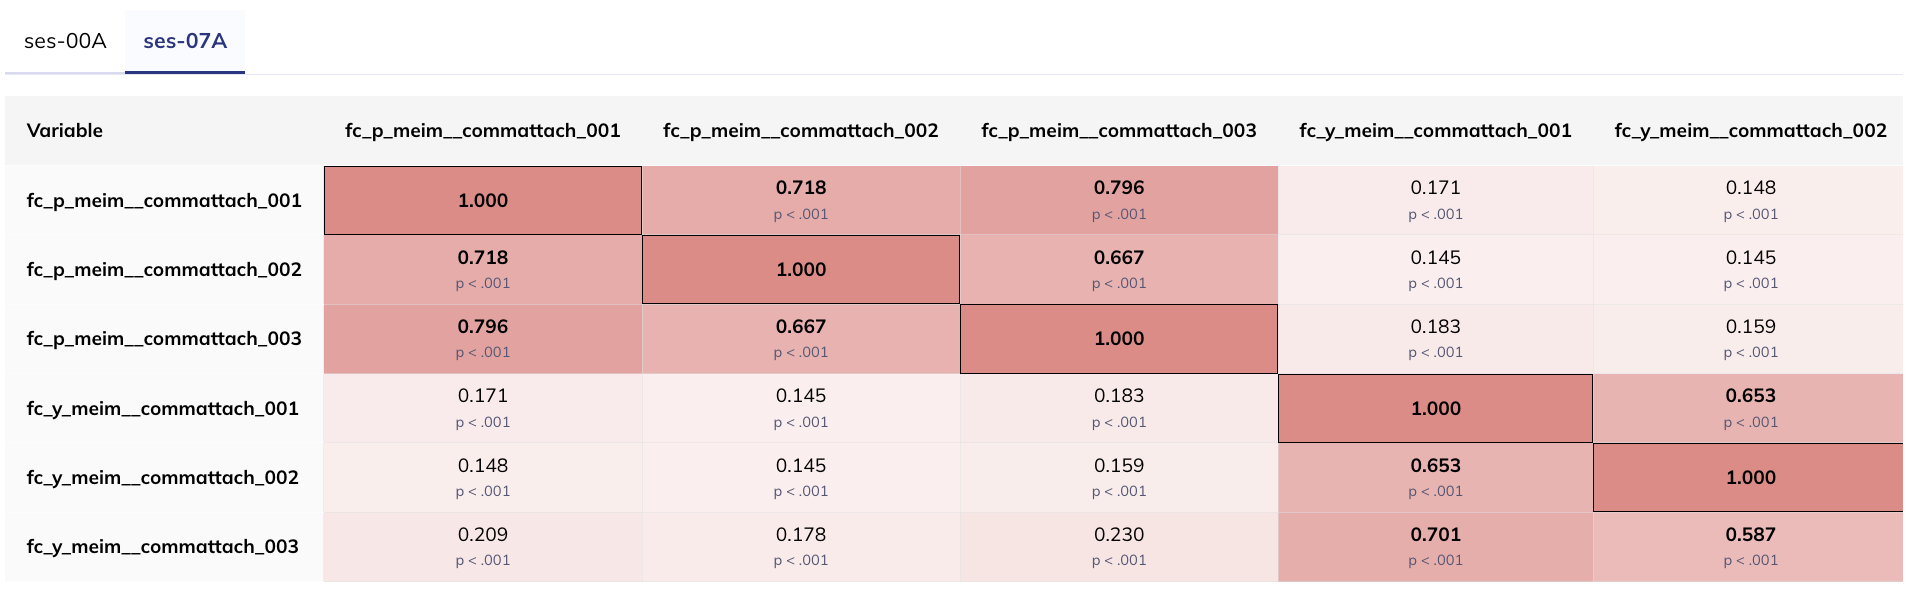
  • Variables
  • Settings/Notes
Variable(s) fc_p_meim__commattach_001
fc_p_meim__commattach_002
fc_p_meim__commattach_003
fc_y_meim__commattach_001
fc_y_meim__commattach_002
fc_y_meim__commattach_003
Correlation mode Between variables
Stratification None
Correlation type Spearman
Heatmap colors True
Include p-values True
 

Data Analysis & Exploration Portal